
This content originally appeared on DEV Community and was authored by varunprashar5
You can find it using Chrome via "Dev Tools" ?
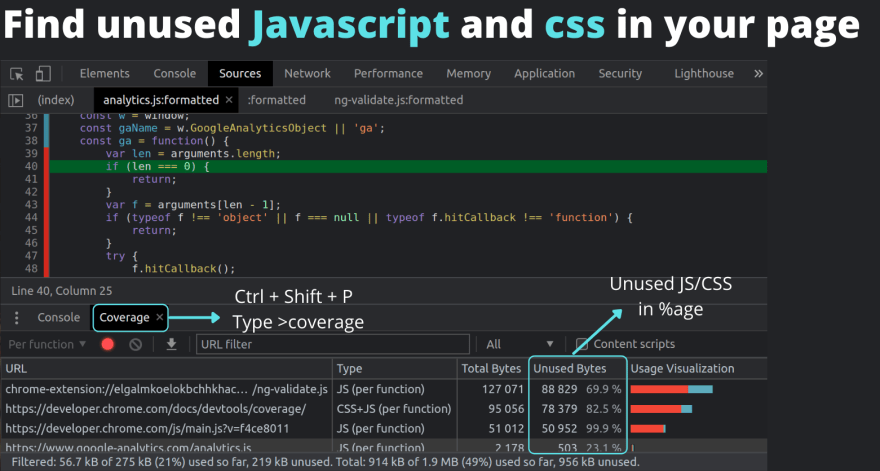
- Open dev tools (F12)
- Type: Ctrl + Shift + P
- Type: "Coverage" and select "show coverage" from the result.
- New window with the "Coverage" tab will be shown
- Click Icon "Start Instrumenting Coverage And Reload Page"
So it will reload the page and show the information in the table
with "Url", "Type", "UnusedBytes", "Usage Visualization"
????? ?????????????:
- Red section of the bar is unused bytes
- Green section is used bytes.
?? ???? ??? ???? ????? ?
Refactoring your codebase so that each page only ships the Javascript and CSS that it needs (this can be a tricky part ?)
Do share your thoughts and other suggestions in the comments
This content originally appeared on DEV Community and was authored by varunprashar5
varunprashar5 | Sciencx (2021-06-17T09:45:35+00:00) ??? ?? ???? “UNUSED’ ?????????? ??? ??? ???? ?? ???? ????? ?. Retrieved from https://www.scien.cx/2021/06/17/%f0%9d%97%9b%f0%9d%97%bc%f0%9d%98%84-%f0%9d%98%81%f0%9d%97%bc-%f0%9d%97%b3%f0%9d%97%b6%f0%9d%97%bb%f0%9d%97%b1-unused-%f0%9d%97%9d%f0%9d%97%94%f0%9d%97%a9%f0%9d%97%94%f0%9d%97%a6%f0%9d%97%96/
Please log in to upload a file.
There are no updates yet.
Click the Upload button above to add an update.