
This content originally appeared on DEV Community and was authored by bytefish
Debug is a skill that every developer must master, and adding breakpoints to the code is the basic of debugging. This article will share 5 ways to add breakpoints in Chrome DevTool.
1# Add breakpoints directly
Go to Source Tag of Chrome Devtools, click the line number where the code is located to add a breakpoint.
This should be the most common way for everyone to add breakpoints.
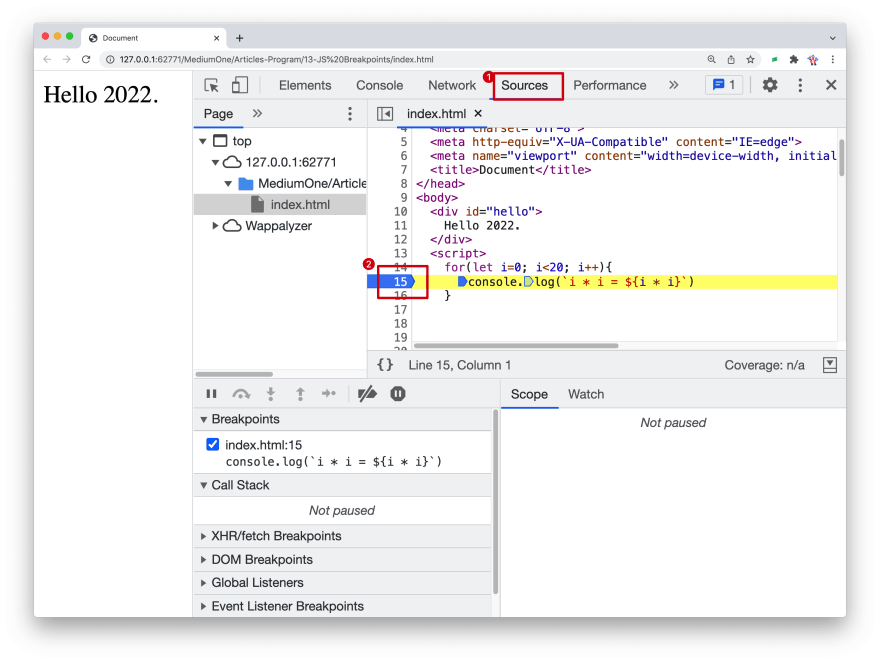
2# Conditional breakpoints
But sometimes, we want a breakpoint to take effect only under certain conditions. At this time, we can take the following approach.
- Right-click the line number column
- Choose Add conditional breakpoint
- Enter your condition in the dialog
For Example, we want to pause the code when i is greater than 10,
for(let i=0; i<20; i++){
     console.log(`i * i = ${i * i}`)
}
We can:

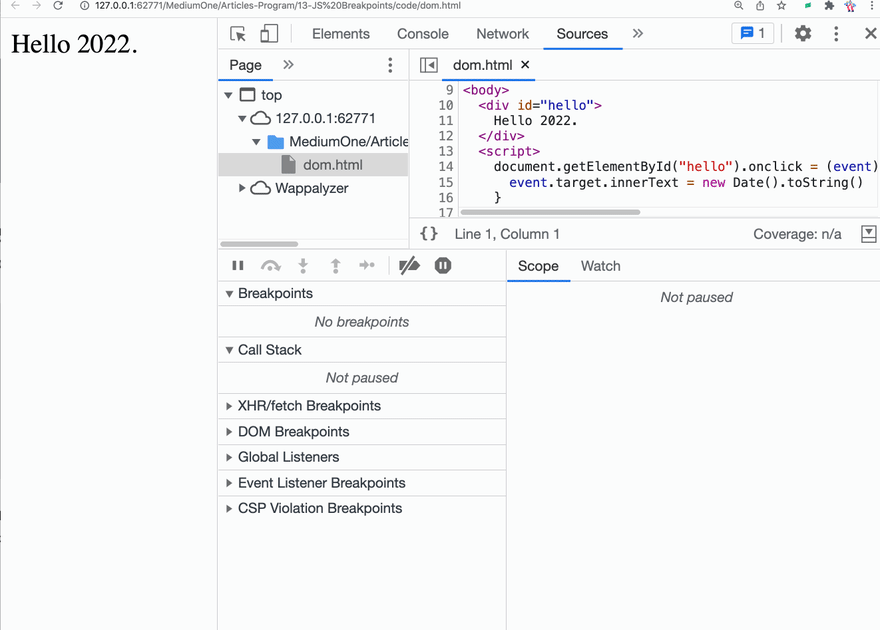
3# DOM change breakpoints
In some cases, we don't want to pause the code at a certain location, but only when a DOM element changes. At this time, we can do this:
Click the Elements tab.
Go to the element that you want to set the breakpoint on.
Right-click the element.
Hover over Break on then select Subtree modifications, Attribute modifications or Node removal.
For example, we want to pause the code when the hello element will change:
<div id="hello">
    Hello 2022.
</div>
<script>
    document.getElementById("hello").onclick = (event) => {
      event.target.innerText = new Date().toString()
    }
</script>
We can:

Note:
Subtree modifications. Triggered when a child of the currently-selected node is removed or added, or the contents of a child are changed. Not triggered on child node attribute changes, or on any changes to the currently-selected node.
Attributes modifications: Triggered when an attribute is added or removed on the currently-selected node, or when an attribute value changes.
Node Removal: Triggered when the currently-selected node is removed.
4# XHR/Fetch breakpoints
If you want to pause the code when JavaScript is trying to make an HTTP request to a URL, we can do this:
- Click the Sources tab. Expand the XHR Breakpoints pane. Click Add breakpoint. Enter the string which you want to break on. DevTools pauses when this string is present anywhere in an XHR's request URL. Press Enter to confirm.
For example, we want to pause the code when the script tries to requesting api.github.com .
<body>
  <div id="hello">
    Hello 2022.
  </div>
  <script>
    fetch("https://api.github.com")
     .then(res => {
       console.log(res)
     })
  </script>
</body>
We can:

5# Event listener breakpoints
Of course, we can also pause the code when a certain event is triggered.
<body>
  <div id="hello">
    Hello 2022.
  </div>
  <script>
    document.getElementById("hello").onclick = (event) => {
      console.log('hello 2022')
    }
  </script>
</body>
If you want to pause the code after the hello element is clicked, then we can do this:
This content originally appeared on DEV Community and was authored by bytefish
bytefish | Sciencx (2022-01-07T07:43:51+00:00) 5 Ways to Add Breakpoints on Chrome Devtools. Retrieved from https://www.scien.cx/2022/01/07/5-ways-to-add-breakpoints-on-chrome-devtools/
Please log in to upload a file.
There are no updates yet.
Click the Upload button above to add an update.