
This content originally appeared on DEV Community and was authored by Dilmohit
Hey guys today in this article, we will be talking about implementing charts in our android app using java. Charts can be used to show data in a beautiful and professional manner. Below is the step by step process on implementing charts in our android project.
So In the first step we will be adding this library in our project
dependencies {
    implementation 'com.github.PhilJay:MPAndroidChart:v3.1.0'
}
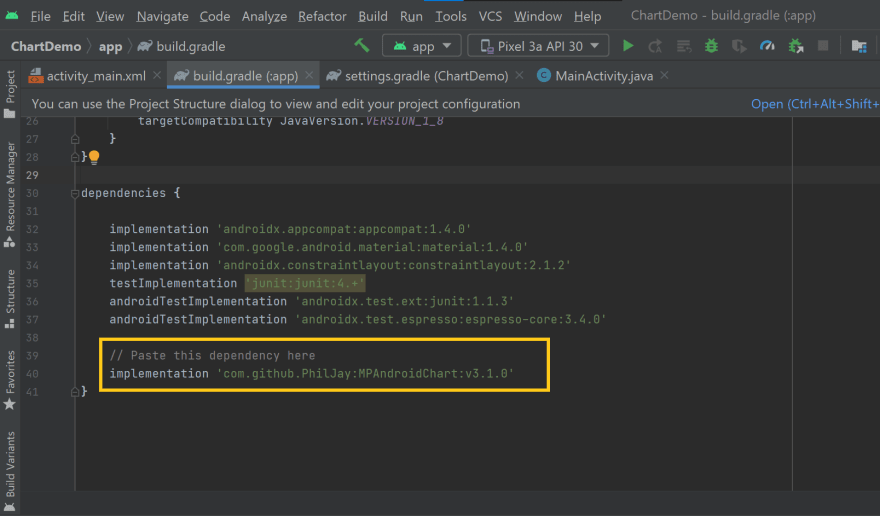
This is library by Philipp Jahoda. its a lightweight library and a great way to explore charts in android.
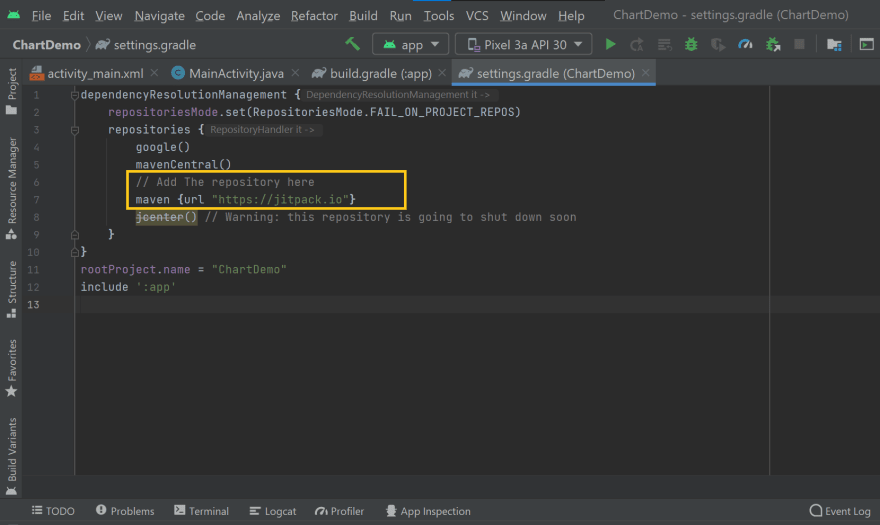
Second step will be to add this repository in our settings.gradle
repositories {
    maven { url 'https://jitpack.io' }
}
In the next step add this code in your activity_main.xml or whatever activity that you are using to show charts.
<?xml version="1.0" encoding="utf-8"?>
<LinearLayout xmlns:android="http://schemas.android.com/apk/res/android"
    xmlns:tools="http://schemas.android.com/tools"
    android:layout_width="match_parent"
    android:layout_height="match_parent"
    android:orientation="vertical"
    android:padding="16dp"
    tools:context=".MainActivity">

   <com.github.mikephil.charting.charts.BarChart
       android:layout_width="match_parent"
       android:layout_height="0dp"
       android:layout_weight="1"
       android:id="@+id/bar_chart"
       android:layout_marginBottom="8dp"/>

    <com.github.mikephil.charting.charts.PieChart
        android:layout_width="match_parent"
        android:layout_height="0dp"
        android:layout_weight="1"
        android:id="@+id/pie_chart"
        android:layout_marginTop="8dp"/>

</LinearLayout>
Logic - So lets just first understand what is happening here. In this activity you can see at first we have Linear Layout as our root element. Then we have two child elements, first one is bar chart and second is Pie chart.
These are elements that are provided by the library that we have used in our project. Now this library does not only gives you two types of charts, it has a lot i mean a lot of chart options that you should check by yourself. But for the sake of this tutorial we have these two type of charts bar chart and Pie chart.
At last add this code in your MainActivity.java or again whatever activity you are using to show your charts.
package com.example.chartdemo;

import androidx.appcompat.app.AppCompatActivity;
import android.graphics.Color;
import android.os.Bundle;
import com.github.mikephil.charting.charts.BarChart;
import com.github.mikephil.charting.charts.PieChart;
import com.github.mikephil.charting.data.BarData;
import com.github.mikephil.charting.data.BarDataSet;
import com.github.mikephil.charting.data.BarEntry;
import com.github.mikephil.charting.data.PieData;
import com.github.mikephil.charting.data.PieDataSet;
import com.github.mikephil.charting.data.PieEntry;
import com.github.mikephil.charting.utils.ColorTemplate;
import java.util.ArrayList;

public class MainActivity extends AppCompatActivity {

    // Initialize Variables
    BarChart barChart;
    PieChart pieChart;

    @Override
    protected void onCreate(Bundle savedInstanceState) {
        super.onCreate(savedInstanceState);
        setContentView(R.layout.activity_main);

        // Assign Variables
        barChart = findViewById(R.id.bar_chart);
        pieChart = findViewById(R.id.pie_chart);

        // Initialize Array List
        ArrayList<BarEntry> barEntries = new ArrayList<>();
        ArrayList<PieEntry> pieEntries = new ArrayList<>();

        // Use For Loop
        for (int i=1; i<10; i++){

            // Convert To Float
            float value = (float) (i*10.0);

            // Initialize Bar and Pie Chart Entry
            BarEntry barEntry = new BarEntry(i, value);
            PieEntry pieEntry = new PieEntry(i, value);

            // Add Values in Array List
            barEntries.add(barEntry);
            pieEntries.add(pieEntry);

        }

        // Initialize Bar Data Set
        BarDataSet barDataSet = new BarDataSet(barEntries, "Investment");

        // Set Colors
        barDataSet.setColors(ColorTemplate.COLORFUL_COLORS);

        // Hide draw values
        barDataSet.setDrawValues(false);

        // Set Bar Data
        barChart.setData(new BarData(barDataSet));

        // Set Animations
        barChart.animateY(5000);

        // Set Description text and color
        barChart.getDescription().setText("Investment chart");
        barChart.getDescription().setTextColor(Color.BLUE);


        // Initialize Pie Data Set
        PieDataSet pieDataSet = new PieDataSet(pieEntries,"Investors");

        // Set Colors
        pieDataSet.setColors(ColorTemplate.COLORFUL_COLORS);

        // Set Pie Data
        pieChart.setData(new PieData(pieDataSet));

        // Set Animations
        pieChart.animateXY(5000,5000);

        // hide description
        pieChart.getDescription().setEnabled(false);
    }
}
Logic - At first we have Initialize our bar and pie charts. Next in our onCreate method we have assigned variables. Then we have assigned array list and used for loop. And at last we have Intialize Data sets for both our Pie chart and Bar chart.
Output -
Comments are added to better understand the logic. Don't forget to visit the github page of this library
MPAndroidChart
This content originally appeared on DEV Community and was authored by Dilmohit
Dilmohit | Sciencx (2022-01-07T14:39:11+00:00) How to implement charts in android using java. Retrieved from https://www.scien.cx/2022/01/07/how-to-implement-charts-in-android-using-java/
Please log in to upload a file.
There are no updates yet.
Click the Upload button above to add an update.