
This content originally appeared on DEV Community and was authored by Nelson Adonis Hernandez
For this example we will use Docker compose to be able to run all the services
1.Docker Compose
version: "3.9"
services:
  grafana:
    image: grafana/grafana
    ports:
      - 3000:3000

  prometheus:
    image: prom/prometheus
    ports:
      - 9090:9090
    volumes:
      - ./prometheus.yml:/etc/prometheus/prometheus.yml:ro

  postgres:
    image: postgres:12
    ports:
      - 5432:5432
    volumes:
      - ./backup:/var/lib/postgresql/data
    environment:
      POSTGRES_PASSWORD: postgrespassword
      POSTGRES_DB: shop

  postgres-exporter:
    image: prometheuscommunity/postgres-exporter
    ports:
      - 9187:9187
    environment:
      DATA_SOURCE_NAME: "postgresql://postgres:postgrespassword@postgres:5432/shop?sslmode=disable"
    links:
      - postgres
      - prometheus
2.Prometheus File Settings (prometheus.yml)
global:
  scrape_interval: 15s
  evaluation_interval: 15s

scrape_configs:
  - job_name: prometheus
    static_configs:
      - targets: ["localhost:9090"]
  - job_name: postgres-exporter
    static_configs:
      - targets: ["postgres-exporter:9187"]
3.Run Docker Compose
docker-compose up
4.Check status of Prometheus and Redis Exporter
http://localhost:9090/targets
5.Visit Grafana Dashboard
Default
User: admin
Password: admin
http://localhost:3000

6.Add data source

Save and test

7.Import PostgreSQL Dashboard for Prometheus
For this we will use a Dashboard created by the community

https://grafana.com/grafana/dashboards/9628
8.Import JSON of code


Code: 9628
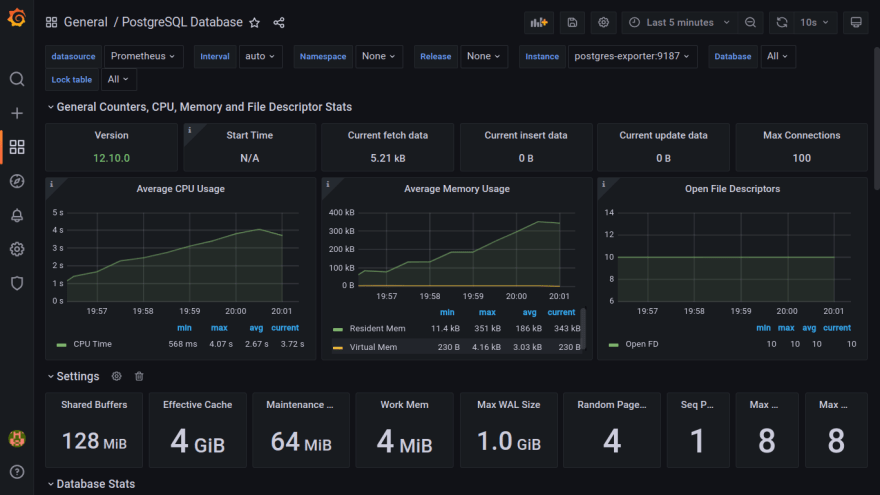
9.Dashboard
Code of example (GitHub Gist)
https://gist.github.com/nelsoncode019/1c0f7930aab755223de7f971f3aca94b
This content originally appeared on DEV Community and was authored by Nelson Adonis Hernandez
Nelson Adonis Hernandez | Sciencx (2022-02-12T02:26:00+00:00) How to monitor PosgreSQL with Prometheus and Grafana | Docker. Retrieved from https://www.scien.cx/2022/02/12/how-to-monitor-posgresql-with-prometheus-and-grafana-docker/
Please log in to upload a file.
There are no updates yet.
Click the Upload button above to add an update.