
This content originally appeared on Level Up Coding - Medium and was authored by Siddharth Kshirsagar
Deploy an ML Project as Dashboard with Google Authentication
Deploy machine learning algorithm as an app on the internet with added security of google authentication.

This project is the second part of a full project, find the first part at
https://siddharth1.medium.com/loading-and-extraction-83fedad258f0
The code for this article can be found at
kshirsagarsiddharth/plotly_dash_dashboard_for_car_prediction (github.com)
We need to create core components for all the 8 input columns
Let's Start with km_travelled. I will create a core component for each column and show the steps taken incrementally. Then finally I will deploy this app as a python script
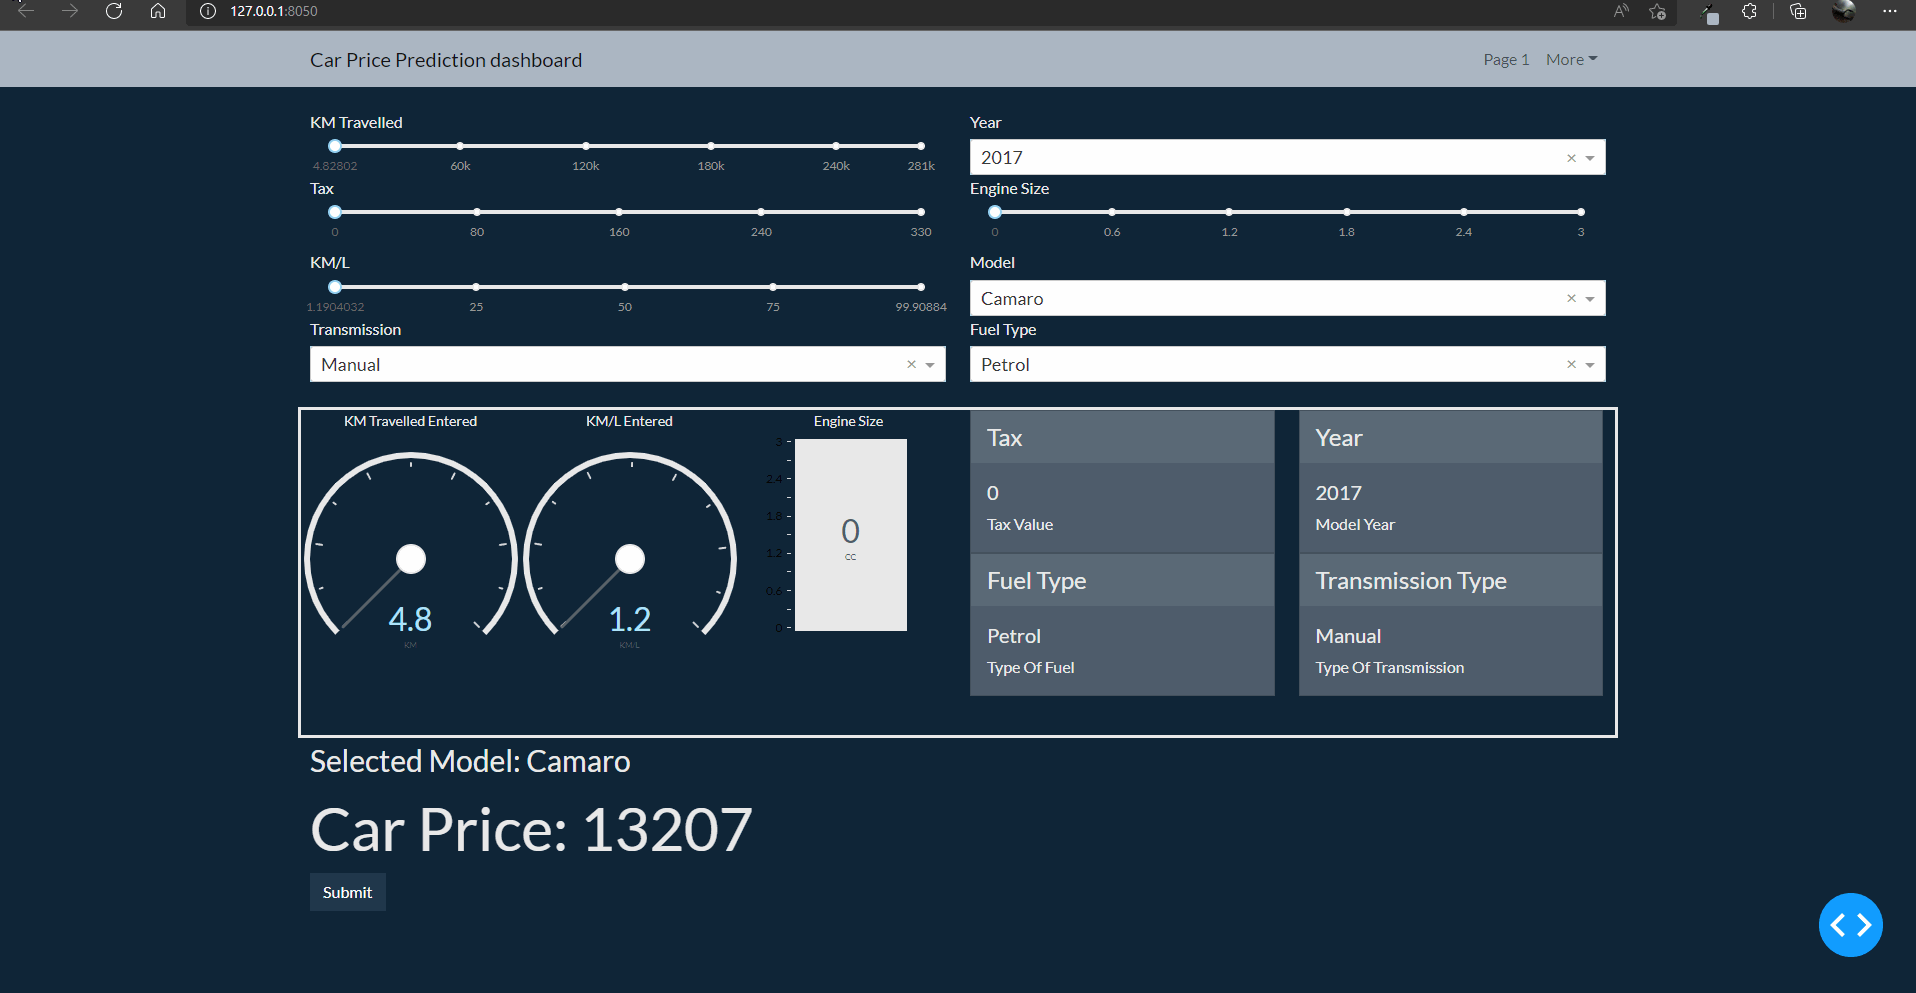
How the app will work finally
How the app will look finally
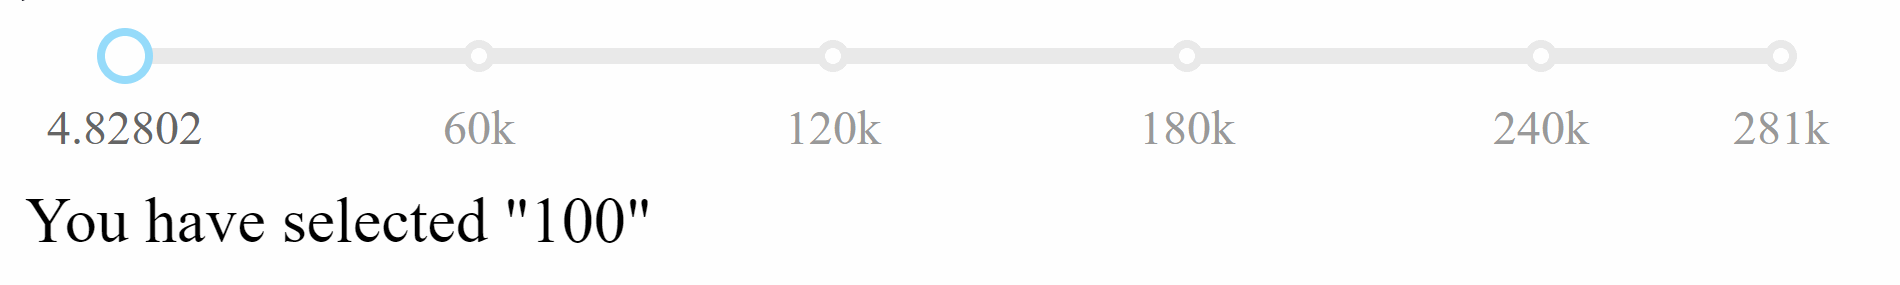
1. Core component for km_travelled
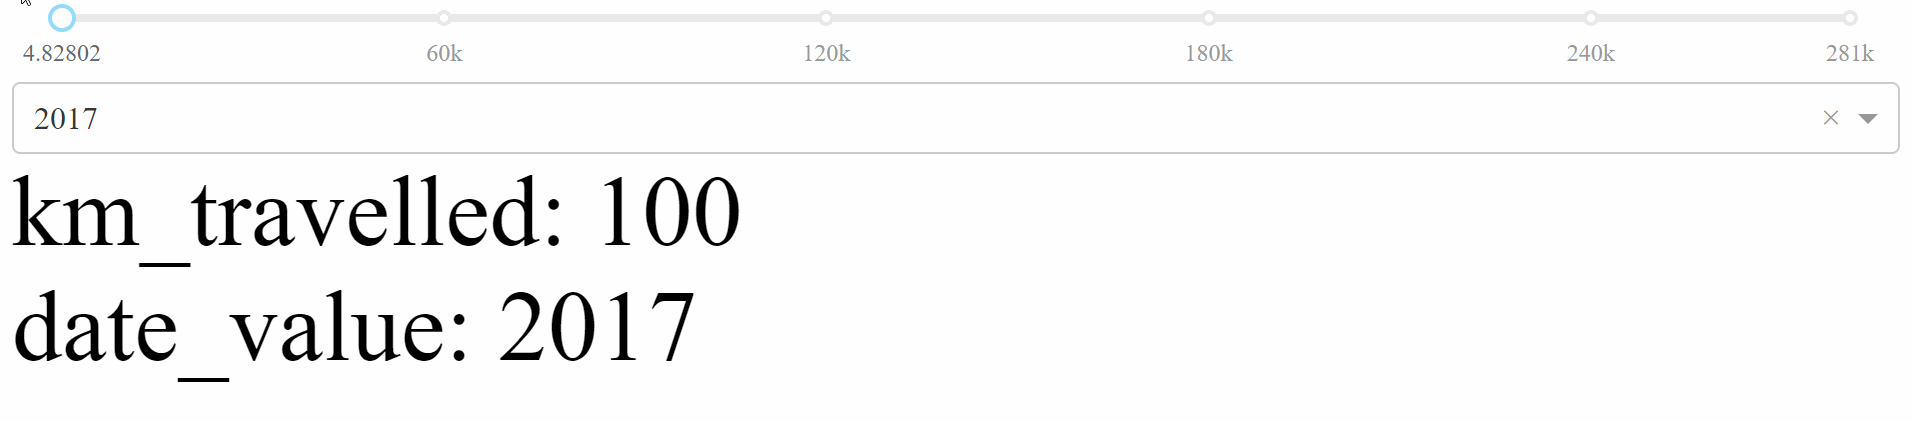
2. Core component for year of the model
3. Core Component For engine Size and tax

Adding remaining columns as components

Now that all core components are prepared, before adding model to perform prediction we have a problem in this approach.
- In the above code, the callback function is fired whenever any of the attributes described by the Input change.
- Try it for yourself by entering data in the inputs above. To remedy this we will use State which allows you to pass along extra values without firing the callbacks.
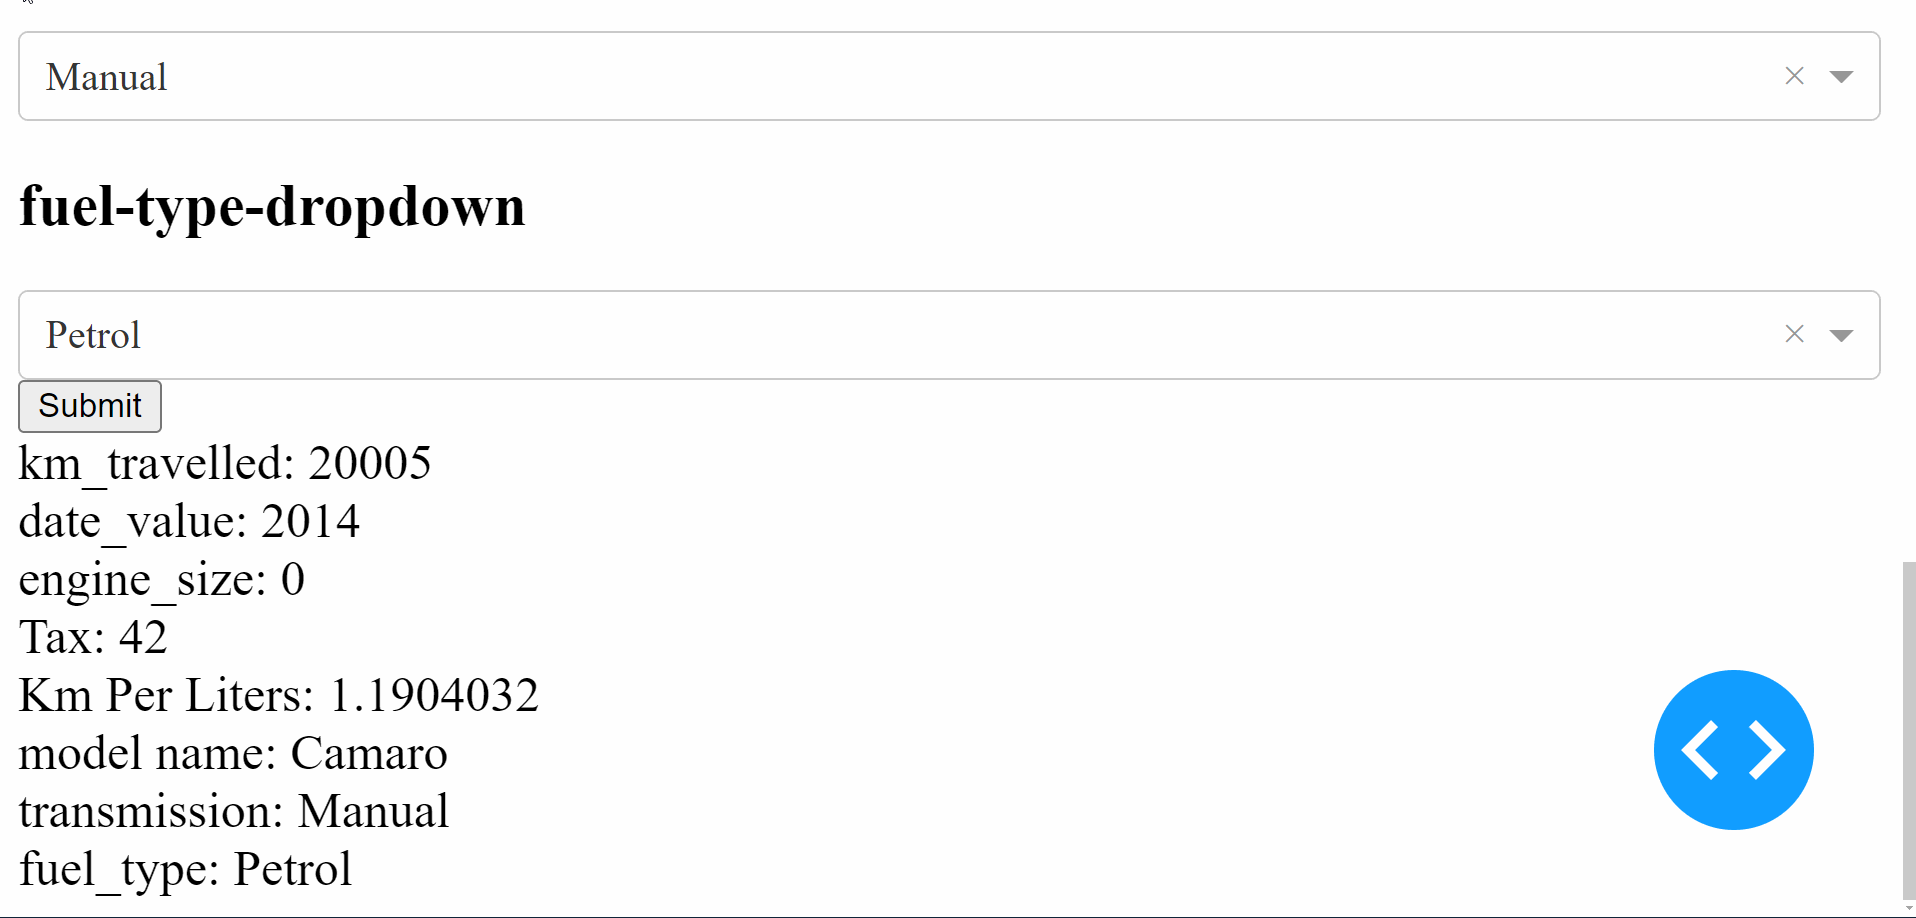
- Here’s the same example as above but with the dcc.Input components as State and a new button component as an Input. In other words, we want to call the machine learning algorithm only when we click the submit button.
Look Close at the gif, the components are updating only when we click the submit key
Now that we are taking all the inputs,Lets load the model and predict the prices in real time

Finally the app is working lets make this app realy beautiful using dash bootstrap components
Note: This marks the end of skeleton of the dashboard from here on we will only be improving the looks of dashboard
Dash Bootstrap components minimal example
Now we run the same code as above difference being we are storing the inputs into a variable, Lets substitute the elements of div into variables.
Let me illustrate this using the below image

Lets convert above app into rows and columns of bootstrap components and substitute the rows using variables,
- For this reason I have created 2 files one is utils.py and other being app.py In utils I am defining row1 and in app.py I am importing the row.
- In below code only one component is converted into dbc row.
Note: Please run the code from this point through a python script by creating 2 files, and uncomment the code from utils import row1,row2
```
# utils.py

import pandas as pd
from dash import dcc, html
import dash_bootstrap_components as dbc
import numpy as np

df = pd.read_csv('car_price_data.csv').drop('Unnamed: 0', axis=1)


row1 = dbc.Row([
    dbc.Col(html.H5('KM Travelled')),
    dbc.Col(dcc.Slider(
        min=df['km_traveled'].min(),
        max=df['km_traveled'].max(),
        value=100.0,
        id='km-travelled-slider',
        tooltip={"placement": "bottom"}
    )),
    dbc.Col(html.H5('Pick Car Year')),
    dbc.Col(dcc.Dropdown(
        id='year-picker',
        options=np.sort(df['year'].unique()),
        value=2017
    ))
])
# app.py
from datetime import date
import joblib
from jupyter_dash import JupyterDash
from utils import row1
loaded_model = joblib.load('final_car_prediction_model.pkl')
app = JupyterDash(__name__, external_stylesheets = [dbc.themes.BOOTSTRAP])
app.layout = html.Div([
   row1,


    html.H2('tax-picker'),
    dcc.Slider(
        min=df['tax'].min(),
        max=df['tax'].max(),
        value=df['tax'].min(),
        id='tax-slider',
        tooltip={"placement": "bottom"}
    ),
    html.H2('engine-size'),
    dcc.Slider(
        min=df['engineSize'].min(),
        max=df['engineSize'].max(),
        value=df['engineSize'].min(),
        id='engine-size-slider',
        marks={i: str(i) for i in np.sort(df['engineSize'].unique())},
        tooltip={"placement": "bottom"}
    ),

    html.H2('km-per-liter'),
    dcc.Slider(
        min=df['km_per_liters'].min(),
        max=df['km_per_liters'].max(),
        value=df['km_per_liters'].min(),
        id='km-per-liters-slider',
        tooltip={"placement": "bottom"}
    ),

    html.H2('model-dropdown'),
    dcc.Dropdown(
        id='model-dropdown',
        options=np.sort(df['model'].unique()),
        value=df['model'][0]
    ),
    html.H2('transmission-dropdown'),
    dcc.Dropdown(
        id='transmission-dropdown',
        options=np.sort(df['transmission'].unique()),
        value=df['transmission'][0]
    ),

    html.H2('fuel-type-dropdown'),
    dcc.Dropdown(
        id='fuel-type-dropdown',
        options=np.sort(df['fuel_type'].unique()),
        value=df['fuel_type'][0]
    ),
    html.Button(id='submit-button-state', n_clicks=0, children='Submit'),


    html.Div([
        html.Div(id='km-travelled-slider-output',
                 children=[html.P('km-travelled-slider-output'), ]),
        html.Div(id='year-picker-output'),
        html.Div(id='engine-size-slider-output'),
        html.Div(id='tax-slider-output'),
        html.Div(id='km-per-liters-slider-output'),
        html.Div(id='model-dropdown-output'),
        html.Div(id='transmission-dropdown-output'),
        html.Div(id='fuel-type-dropdown-output'),
        html.Div(id='prediction', style={'font-size':'60px'})
    ], style={'font-size': '20px'})

])


@app.callback(
    Output('km-travelled-slider-output', 'children'),
    Output('year-picker-output', 'children'),
    Output('engine-size-slider-output', 'children'),
    Output('tax-slider-output', 'children'),
    Output('km-per-liters-slider-output', 'children'),
    Output('model-dropdown-output', 'children'),
    Output('transmission-dropdown-output', 'children'),
    Output('fuel-type-dropdown-output', 'children'),
    Output('prediction', 'children'),

    Input('submit-button-state', 'n_clicks'),
    State('km-travelled-slider', 'value'),
    State('year-picker', 'value'),
    State('engine-size-slider', 'value'),
    State('tax-slider', 'value'),
    State('km-per-liters-slider', 'value'),
    State('model-dropdown', 'value'),
    State('transmission-dropdown', 'value'),
    State('fuel-type-dropdown', 'value')
)
def update_output(n_clicks, km_travelled, date_value, engine_size, tax_value, km_per_liters, model_name, transmission, fuel_type):
    prediction = loaded_model.predict(pd.DataFrame(
        data=[[str(date_value), km_travelled, tax_value, engine_size,
               km_per_liters, model_name, transmission, fuel_type]],
        columns=joblib.load('column_names.pkl')))

    return (f"km_travelled: {km_travelled}",
            f"date_value: {date_value}",
            f"engine_size: {engine_size}",
            f"Tax: {tax_value}",
            f"Km Per Liters: {km_per_liters}",
            f"model name: {model_name}",
            f"transmission: {transmission}",
            f"fuel_type: {fuel_type}",
            f"prediction: {prediction}"
            )


# app.run_server(mode="inline")
app.run_server()
Dash app running on http://127.0.0.1:8050/

Next I want some visual feedback on what values the user is entering in real time so I am using different functions for different inputs. And the visual feedback of each input is captured through the output component.
- I have used dash daq as visual output of input components
- Dash DAQ comprises a robust set of controls that make it simpler to integrate data acquisition and controls into your Dash applications.
In the following code I have defined the components which will directly read from the input core components and display realtime output thats why I needed to create seperate callbacks for each components.
Respective Callback for each component output
Final Structure of app
Find code at GitHub for final implementation This is how the app will look

Adding Google and github Oauth
(article is coming but the code is at)
kshirsagarsiddharth/prediction_with_security (github.com)
Deployment of Heroku
to be continued……
Deploy ML project as Dashboard with Google Authentication was originally published in Level Up Coding on Medium, where people are continuing the conversation by highlighting and responding to this story.
This content originally appeared on Level Up Coding - Medium and was authored by Siddharth Kshirsagar
Siddharth Kshirsagar | Sciencx (2022-03-27T15:27:52+00:00) Deploy ML project as Dashboard with Google Authentication. Retrieved from https://www.scien.cx/2022/03/27/deploy-ml-project-as-dashboard-with-google-authentication/
Please log in to upload a file.
There are no updates yet.
Click the Upload button above to add an update.