
This content originally appeared on DEV Community and was authored by Gleb
👨💻 I want you to become a better software engineer through debugging in this series of articles.
Debugging is the process of detecting and removing existing and potential errors (also called 'bugs') in a software code that can cause it to behave unexpectedly or crash.
⚙️ To configure debugging of Node in a VSCode, you should follow these steps:
Create a folder
.vscodeat the root of your project.Put a file
launch.jsoninside.vscodefolder. This file will be a config file for debugging.Inside
launch.json, you should put this code
{
  "configurations": [
    {
      "name": "Attach by Process ID",
      "processId": "${command:PickProcess}",
      "request": "attach",
      "skipFiles": [
      "<node_internals>/**"
      ],
      "type": "node"
    }
  ]
}
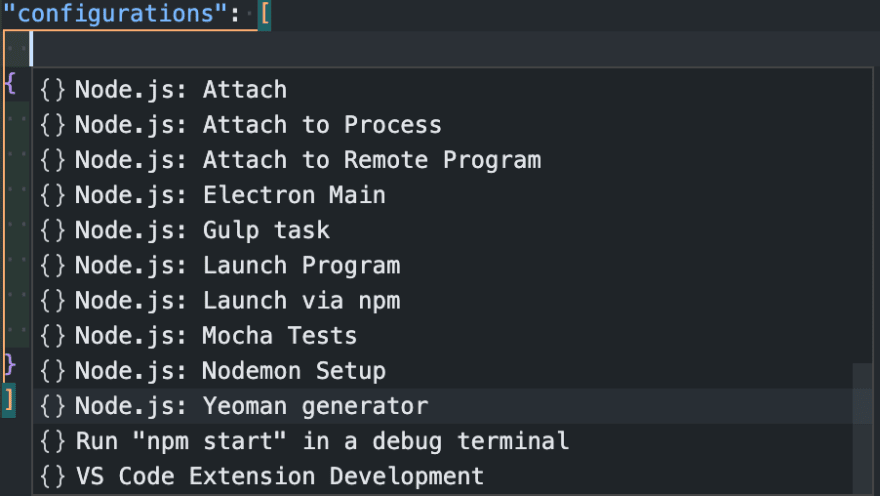
💡 Tip: You can generate the same code by pressing the "Add configuration" button in VSCode bottom right corner.
After clicking the button, you will see a context menu where you should choose Node.js Attach to process.
Node.js Attach to process will bring you the same configuration as in step #3

After that, go to the run and debug section in VSCode

Choose your configuration, and press start

You should pick the node process you want to attach. Your running node application inside VSCode will be in the first place.

But if you didn't find the right PID (process id) of your Node, I recommend you run a command that will show you the id of a running process on the exact localhost.
For macOS
sudo lsof -i :PORT
After getting the right PID, you should put it in a context menu, and here you go!
See you in the following articles 🥳
This content originally appeared on DEV Community and was authored by Gleb
Gleb | Sciencx (2022-05-03T08:18:06+00:00) Debugging Nodejs in VSCode. Retrieved from https://www.scien.cx/2022/05/03/debugging-nodejs-in-vscode/
Please log in to upload a file.
There are no updates yet.
Click the Upload button above to add an update.