
This content originally appeared on Level Up Coding - Medium and was authored by Karl Lykken
Enabling both automated and manual scrolling through images using vanilla JS and the canvas element
Web developers commonly need to create slideshows, cycling through a set of images and displaying each in turn. This tutorial provides an example of creating such a slideshow using the HTML5 canvas, covering both how to set up automated cycling through the images and how to enable users to navigate through the images using either their keyboard or mouse.
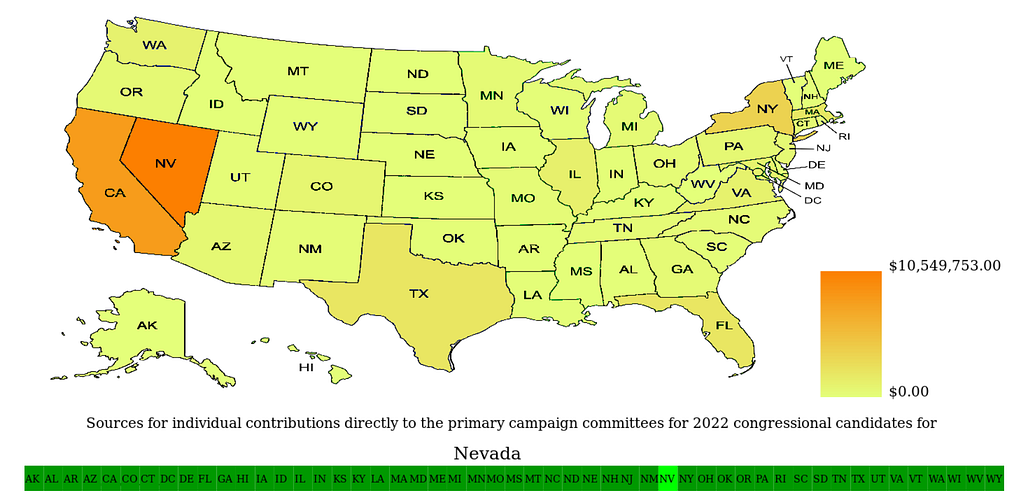
In our example, we will set up a slideshow that displays 51 different heat maps (one for each state in the US, plus one for Washington, DC) showing the sources of individual contributions made directly to the primary campaign committees for congressional candidates for each state. This is the actual approach I used to create the slideshow displaying these maps on WhoTheyRepresent.org.
Creating a basic, automated slide show
In our example, we have a set of 51 PNG images that we want to cycle through, all of which are located in the img subdirectory of the directory containing our HTML/JavaScript code for this site. We will do this by creating an Image object and pointing it to each of the different images in turn with a 5 second wait period between each transition. Each time the Image object is pointed to a new picture, we will draw the image to our HTML canvas (if you are not familiar with the HTML canvas element, the Mozilla Developer Network has an introductory tutorial on working with it), creating our slideshow effect.
As a first step, we will define our HTML canvas object and give it a plain white (#FFFFFF in hex) background. Within our JavaScript code, we will define the variables canvas and ctx to represent our canvas element and its context, respectively. Also, we will define a new Image object, img, though we will not assign an actual PNG image to it yet — that will be handled in a separate function later.
We will initialize several other JavaScript variables as well. To allow us to cycle through the various states and their associated PNG images, we will create an array, states, containing each state’s abbreviation, as well as storing the length of this array in the numStates variable. Also, we will define curSt, which will represent the index in states of the state we want to display the image for at the current time, and initialize it to 0 (Alaska).
As our technique for waiting 5 seconds between image transitions will utilize the setTimeout() function, we will define a timeoutId variable to hold the current timer’s ID returned by this function and initialize it to -1.
To prevent our slideshow from wastefully continuing to load images from our server if someone leaves their browser open to our site, we will also define a maxLoads variable that represents the maximum number of automated image transitions allowed without refreshing the page, and we will set it high enough to allow two full cycles through our images. Our numLoads variable will count the number of image transitions that have occurred (since the last reset), and our paused boolean variable will be used to determine whether the automated cycle should continue running.
<!DOCTYPE html>
<html>
<head>
    <meta charset="utf-8" />
    <title>Heat Maps Example</title>
    <style>
     * { padding: 0; margin: 0; }
     canvas { background: #FFFFFF; display: block; margin: 0 auto; }
    </style>
</head>
<body>
  <canvas id="states_map" width="1400" height="720"></canvas>
  <script>
   const states = ['AK','AL','AR','AZ','CA','CO','CT','DC','DE','FL',
      'GA','HI','IA','ID','IL','IN','KS','KY','LA','MA',
      'MD','ME','MI','MN','MO','MS','MT','NC','ND','NE',
      'NH','NJ','NM','NV','NY','OH','OK','OR','PA','RI',
      'SC','SD','TN','TX','UT','VA','VT','WA','WI','WV',
      'WY'];
   const numStates = 51;
   var curSt = 0;
   var timeoutId = -1;
   const img = new Image();
   img.crossOrigin = "anonymous";
   const canvas = document.getElementById("states_map");
   const ctx = canvas.getContext("2d");
   var paused = false;
   var numLoads = 0;
   const maxLoads = 2*numStates;
Now that we have our canvas element, Image object, and other needed variables, we can define our loadMapImg() function, which increments our state counter (if the slideshow is not paused) and assigns the map for the state represented by curSt to our img object. Since the images in our example follow a standard naming convention, we simply plug the relevant state abbreviation from states[] into a string representing our relative file path. We could instead have stored whole file names/paths in our array (or read them dynamically from another file) if we didn’t have a standardized naming convention.
Note that when we increment our curSt variable to point to the next state, we take the result of this incremented value modulo numStates so that after we reach the end of our slideshow, it will wrap back around to the beginning.
function loadMapImg() {
  if(paused === false) {
   curSt = (curSt+1)%numStates;
  }
  img.src = "./img/"+states[curSt]+"_indiv_cont_sources_2022.png";
 };
Now, we can add an event listener that will trigger every time our img object loads, which will occur shortly after each time img.src is pointed to a new PNG by our loadMapImg() function. We will have this event listener call a new function, drawMaps(), which will draw our PNG to the canvas.
img.addEventListener("load", () => {
        drawMaps();
 });
Our drawMaps() function needs to perform a few steps. First, it needs to draw the current PNG file loaded to our img object to the canvas using the ctx.drawImage() method.
If our slideshow is paused (ie if paused is true), then that is all this function will do. If paused is false, though, our function will first check if our numLoads counter exceeded our maximum transition count, maxLoads. If so, we will call another function, pause() (to be defined shortly), to pause our slideshow.
If we have not reached our load limit, though, we will call the setTimeout() function and pass it loadMapImg (the function we defined earlier) and 5000 as inputs. This way, setTimeout() will wait 5000 milliseconds (or 5 seconds) before calling our loadMapImg() function, thereby creating our slideshow loop (as the completion of loadMapImg() will trigger our event listener for img loads, which in turn calls drawMaps(), which will call loadMapImg() again unless we hit our load limit or the slideshow is paused).
Note that the return value of setTimeout() is stored in our timeoutID variable, and we increment numLoads after calling setTimeout() to track that another image has been loaded.
function drawMaps() {
  // draw current map
  ctx.drawImage(img, 0, 0, canvas.width, canvas.height);

  // automated reload handling if not paused
  if(paused === false) {
     if(numLoads >= maxLoads) { // pause if too many automated loads
       pause();
     }
     else { // otherwise, set reload timer and increment load counter
       timeoutID = setTimeout(loadMapImg, 5000);
       numLoads += 1;
     }
  }
 };
The pause() function, used in drawMaps(), will need to perform two tasks. First, if timeoutID is set equal to an actual timer’s ID, we want to call clearTimeout() to prevent the current timer from completing and calling loadMapImg again. We can set timeoutID to -1 after clearing the associated timer. Then, we can set paused to true so that calls to drawMaps() will no longer trigger another timer.
function pause() {
  if(timeoutID > -1) {
   clearTimeout(timeoutID);
   timeoutId = -1;
  }
  paused = true;
};
Finally, at the bottom of our script, we will call loadMapImg(), which will trigger our slideshow loop upon the page being loaded.
  loadMapImg();
</script>
At this point, we have a simple slideshow that will cycle through and display our set of 51 heat maps twice.
Adding a display bar
To give users a sense of where they are in the slide show, we can add a menu bar to the bottom of our image showing the 50 different states plus DC, and highlight which state’s heat map is currently being displayed. Fortunately, the canvas element makes it relatively simple to draw such a menu bar over our image.
To accomplish this, we will first add a few new variable declarations near the top of our script. These will represent the size and location of our menu bar, and we will define them as fractions of our canvas’ width and height to make scaling easier.
const menuTop = 19*canvas.height/20;
const menuHeight = canvas.height/20;
const menuItemWidth = canvas.width/numStates;
Next, we can add a code snippet to our drawMaps() function to cycle through every item in states[] and draw a rectangle containing the state abbreviation (ie the associated value stored in states[]) for each state. We will use the ctx.rect() method to created the rectangles and ctx.fillText() to draw the state abbreviations. When we are drawing the menu item for the state for which the heat map is currently being displayed, we will use a different color (ie ctx.fillStyle) to create the highlight effect.
  // draw states menu bar, one state at a time
  for(let i = 0; i < numStates; i++) {
   // draw rectangle in menu representing this state
   ctx.beginPath();
   ctx.rect(i*menuItemWidth,
    menuTop,
    menuItemWidth,
    menuHeight);
   if(i === curSt) { // highlight current state
    ctx.fillStyle= "#00FF00";
   }
   else {
    ctx.fillStyle = "#009900";
   }
   ctx.fill();
   ctx.closePath();
   // write state abbr to menu bar
   ctx.font = "14px sarif";
   ctx.fillStyle = "#000000";
   ctx.fillText(states[i],
       (i+0.05)*canvas.width/numStates,
       59*canvas.height/60);
  }
So, our final drawMaps() function will look as follows:
function drawMaps() {
// draw current map
ctx.drawImage(img, 0, 0, canvas.width, canvas.height);
// draw states menu bar, one state at a time
for(let i = 0; i < numStates; i++) {
// draw rectangle in menu representing this state
ctx.beginPath();
ctx.rect(i*menuItemWidth,
menuTop,
menuItemWidth,
menuHeight);
if(i === curSt) { // highlight current state
ctx.fillStyle= "#00FF00";
}
else {
ctx.fillStyle = "#009900";
}
ctx.fill();
ctx.closePath();
// write state abbr to menu bar
ctx.font = "14px sarif";
ctx.fillStyle = "#000000";
ctx.fillText(states[i],
(i+0.05)*canvas.width/numStates,
59*canvas.height/60);
}
// automated reload handling if not paused
if(paused === false) {
if(numLoads >= maxLoads) { // pause if too many automated loads
pause();
}
else { // otherwise, set reload timer and increment load counter
timeoutID = setTimeout(loadMapImg, 5000);
numLoads += 1;
}
}
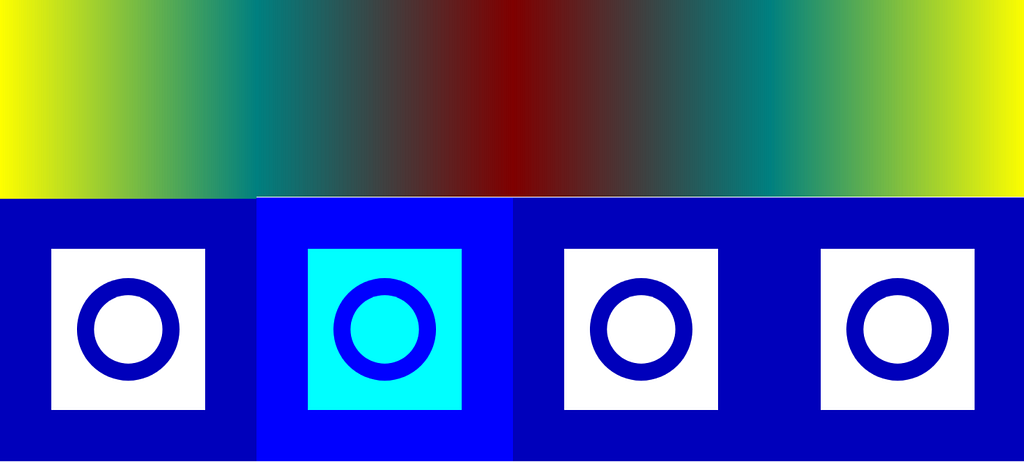
};At this point, we can cycle through our slideshow and draw the appropriate menu bar at the bottom of the image, creating an effect like the below:
Enabling user control of the slideshow
Users might be most interested in a particular state’s heat map, or they might want to pause the slideshow to give themselves more time to look at a given map. To facilitate this, we will implement key handling to let the left/right arrow keys be used for scrolling between images and the space bar be used to pause or resume the slide show. We will also allow for clicking on a state in the menu bar to select its heat map.
We will deal with the keyboard controls first. To listen for clicks, we will need to add an event listener to our script that will call a custom handler function (keyDownHandler()) every time a key is pressed.
document.addEventListener("keydown", keyDownHandler, false);Then, we can define our keyDownHandler() function, which will have a series of if/else statements to perform certain actions if certain keys are pressed, which is determined based on the value of the code attribute of the input object e, passed by our event listener.
If e.code has a value of 'Space’, then the space bar was pressed. In this case, the user presumably either wants to pause the slideshow or, if it is already paused, resume it. So, if paused is currently true, we will call a new function, unpause() (defined later), to resume the slideshow. Otherwise, we will call our existing pause() function. Note that we also call the e.preventDefault() method so that pressing the space bar will not cause the user’s page to scroll down (the default action taken when the space bar is pressed) when they are attempting to pause or resume the slideshow.
If the user presses the right arrow, then we will pause the slideshow using our pause() function to prevent the automated scrolling from interfering with the user’s manual scrolling. Then, we will increment the curSt counter so it points to the next state (or back to the first state if we reach its maximum value) before calling loadMapImg() to load the PNG corresponding to the next state.
Similarly, if the user presses the left arrow, we will call pause() before subtracting 1 from curSt (or setting curSt to its maximum possible value if it is already at the minimum value of 0), and then we will call loadMapImg() to load the corresponding heat map image.
function keyDownHandler(e) {
  if(e.code === 'Space') { // spacebar
   e.preventDefault(); // Prevent spacebar from scrolling down
   if(paused) {
    unpause();
   }
   else {
    pause();
   }
  }
  else if(e.code === 'ArrowRight') { // right arrow
   pause();
   curSt = (curSt+1)%numStates;
   loadMapImg();
  }
  else if(e.code === 'ArrowLeft') { // left arrow
   pause();
   if(curSt === 0) {
    curSt = numStates-1;
   }
   else {
    curSt = (curSt-1)%numStates;
   }
   loadMapImg();
  }
 };
At this point, the left and right arrows should be able to scroll through the different states successfully and the space bar should be able to pause the slideshow, but we still need to define our unpause() function to resume the slideshow. To do this, we will set paused to false and call loadMapImg(), which will load the next image and thereby resume our slideshow cycle. We will also reset numLoads to 0, as the user presumably wants to be able to watch through the full slideshow again if they pressed the key to resume it.
function unpause() {
  paused = false;
  numLoads = 0;
  loadMapImg();
 };
Our keyboard commands should now all be working, but we also want to enable clicking on a menu option to select that state’s heat map. To do this, we will add another event listener, this time for click events on the canvas. When there is a click somewhere on the canvas element, this listener will call a new clickHandler() function and pass the click event as input.
canvas.addEventListener("click", (event) => clickHandler(event));Within clickHandler(), we will use the canvas.getBoundingClientRect() method to return an object representing the rectangle containing our canvas, allowing us to find the relative position of the (x,y) coordinates of the click on our canvas by subtracting the position of the left side of this rectangle from the click location’s x-coordinate and the position of the top of the rectangle from the click location’s y-coordinate. We will store these new coordinates, fitted within our canvas, in the x and y variables.
From there, we need to check if the click falls within the border of one of our menu items. As the vertical positioning of all the menu items is the same, we can simply check if y is greater than menuTop but less than menuTop + menuHeight to determine if it falls within the appropriate vertical range. As the menu spans the full width of our canvas, we can just do a quick safety check to ensure x is both greater than 0 and less than canvas.width to be sure that the click falls somewhere on the menu.
Assuming the above conditions are met, we can call pause() to stop automated scrolling. Then, we can set curSt equal to the value corresponding to the state selected, which can be found by dividing x by the width of each menu item (menuItemWidth) and taking the floor of the result. To understand this calculation, remember that x represents a distance from the left side of our canvas, and that distance corresponds to a particular item. So, if we divide x by the width of each item and round down, we can find the number representing the order (starting from the leftmost item) of the particular item that contains x.
Finally, we call loadMapImg() to display the PNG corresponding to the new value of curSt.
function clickHandler(event) {
   const bounding = canvas.getBoundingClientRect();
   const x = event.clientX - bounding.left;
   const y = event.clientY - bounding.top;

   if((y > menuTop) && (y < menuTop + menuHeight)) { //verify within vertical range of menu
    if((x >= 0) && (x < canvas.width)) { // verify within horizontal range of menu
     pause();
     curSt = Math.floor(x/menuItemWidth);
     loadMapImg();
    }
   }
 };
Conclusion
We have now created a basic slideshow with both automated and manual scrolling features. Using the canvas element, you can also dynamically overlay additional drawings or text on top of your images, or implement some sort of transition animations as you switch between images. Explore the possibilities, and happy coding!
Resources
Sample website using this technique: WhoTheyRepresent.org
MDN HTML canvas tutorial: https://developer.mozilla.org/en-US/docs/Web/API/Canvas_API/Tutorial
MDN Image object documentation: https://developer.mozilla.org/en-US/docs/Web/API/HTMLImageElement/Image
MDN setTimeout documentation: https://developer.mozilla.org/en-US/docs/Web/API/setTimeout
MDN clearTimeout documentation: https://developer.mozilla.org/en-US/docs/Web/API/clearTimeout
MDN canvas drawImage documentation: https://developer.mozilla.org/en-US/docs/Web/API/CanvasRenderingContext2D/drawImage
MDN event listener documentation: https://developer.mozilla.org/en-US/docs/Web/API/EventTarget/addEventListener
MDN getBoundingClientRect documentation: https://developer.mozilla.org/en-US/docs/Web/API/Element/getBoundingClientRect
Creating a Slideshow with the HTML5 Canvas Element was originally published in Level Up Coding on Medium, where people are continuing the conversation by highlighting and responding to this story.
This content originally appeared on Level Up Coding - Medium and was authored by Karl Lykken
Karl Lykken | Sciencx (2022-12-02T17:51:13+00:00) Creating a Slideshow with the HTML5 Canvas Element. Retrieved from https://www.scien.cx/2022/12/02/creating-a-slideshow-with-the-html5-canvas-element/
Please log in to upload a file.
There are no updates yet.
Click the Upload button above to add an update.