
This content originally appeared on Level Up Coding - Medium and was authored by Anas Anjaria
CONTINUOUS ARCHIVING AND POINT-IN-TIME RECOVERY
PostgreSQL — Monitor Continuous Archiving and Point-in-Time Recovery
Welcome to my continuous archiving and point-in-time recovery series.
By now, we have covered the basic concepts required to understand archiving mechanisms, configuration settings to enable storing backups in AWS S3, and how to recover a standalone node using stored backups in the AWS cloud.
This post focuses on monitoring continuous archiving after rolling it out to our production system to ensure stability & reliability.
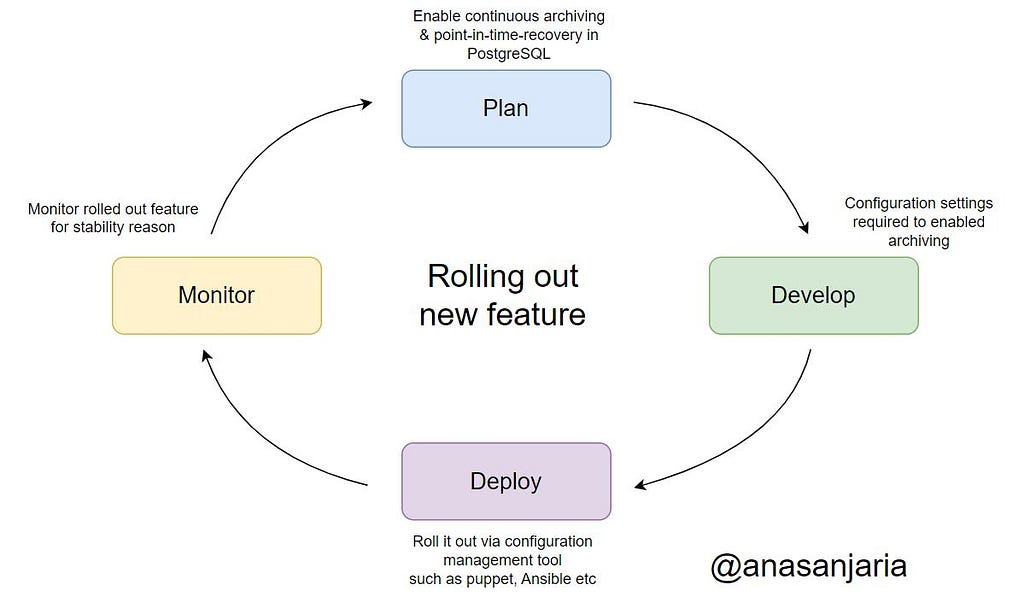
We can ensure the stability & reliability of our backup management if we observe an archiving process & system (or instance) running this process.
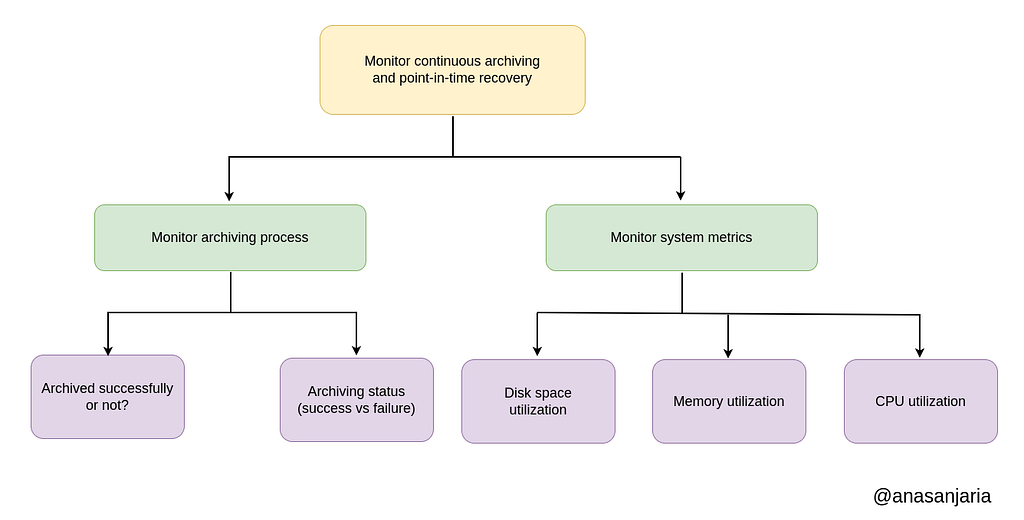
Monitor archiving process
To ensure that our archiving process is running flawlessly, we can observe:
- Archiving status (whether it failed to store backups to AWS cloud).
- Archiving completion (whether backups are stored successfully at regular intervals).
We use the following steps to collect these essential metrics. The idea here is to use log-as-metrics.
- Dump metrics in a log file.
- Ship these metrics to elastic search using filebeat.
- Visualize information using kibana.
- Finally, inform our team in case of failure via slack.
I have explained this approach in more details in my following articles:

- Monitor Ansible Playbook Executions
- Monitor Postgres Performance Using Custom Queries
Monitor archiving status
We can use the following SQL query to monitor archiving.
select * from pg_stat_archiver;
You can check out my article on monitoring Postgres performance using custom queries.
Monitor archiving completion
Since we use wal-g, therefore, we can use the following command to list all backups (stored successfully in AWS S3) for monitoring the archiving process.
Based on timestamp, we can determine whether there is a backup within the last 24h.
wal-g backup-list --json
More precisely, we will use the following command to list backups from AWS S3, dump them to a log file and use it as metrics.
#!/bin/bash

docker run --rm --name monitor-completed-backup \
  --env AWS_REGION='...' \
  --env AWS_ENDPOINT='...' \
  --env WAL_S3_BUCKET='...' \
  --env WALE_S3_PREFIX='...' \
  --env WALE_S3_ENDPOINT='...' \
  registry.opensource.zalan.do/acid/spilo-14:2.1-p7 \
  wal-g backup-list --json | jq -c '.[]' \
  >> /path/to/metrics.log
Please note that we are using jq for manipulating JSON.
Monitor system metrics
We can use metricbeat’s systemmodule for monitoring our system. The configuration would look as follows:
metricbeat.modules:
# https://www.elastic.co/guide/en/beats/metricbeat/current/metricbeat-metricset-system-cpu.html
- module: system
  period: 1m
  metricsets:
    - cpu
    - memory
  process.include_top_n:
    by_cpu: 5      # include top 5 processes by CPU
    by_memory: 5   # include top 5 processes by memory

# https://www.elastic.co/guide/en/beats/metricbeat/current/metricbeat-metricset-system-filesystem.html
- module: system
    period: 30s
    metricsets: ["filesystem"]
    processors:
    - drop_event.when.regexp:
        system.filesystem.mount_point: '^/(sys|cgroup|proc|dev|etc|host)($|/)'
system.filesystem.used.pct -The percentage of used disk space.
system.memory.actual.used.pct — The percentage of actual used memory.
system.cpu.total.pct — The percentage of CPU time spent in states other than Idle and IOWait.
Thanks for reading.
If you have any questions, please feel free to ask in comment’s section.
If you enjoy this post, you might also enjoy my series on site reliability engineering.
Want to connect?

Facebook | LinkedIn | Twitter
PostgreSQL — Monitor Continuous Archiving and Point-in-Time Recovery was originally published in Level Up Coding on Medium, where people are continuing the conversation by highlighting and responding to this story.
This content originally appeared on Level Up Coding - Medium and was authored by Anas Anjaria
Anas Anjaria | Sciencx (2022-12-26T13:33:49+00:00) PostgreSQL — Monitor Continuous Archiving and Point-in-Time Recovery. Retrieved from https://www.scien.cx/2022/12/26/postgresql-monitor-continuous-archiving-and-point-in-time-recovery/
Please log in to upload a file.
There are no updates yet.
Click the Upload button above to add an update.