
This content originally appeared on HackerNoon and was authored by @uKnowWhoDev
\ Integrating Large Language Models (LLMs) with diagramming tools like Mermaid and UML is revolutionizing software development by automating the creation of visual representations from textual descriptions.
\
- Generating Flowcharts from System Descriptions
\ Example:
\ Consider a scenario where a developer needs to visualize the process of a user interacting with an online shopping platform. By providing a textual description to an LLM, the model can generate the corresponding Mermaid code for a flowchart.
\ Description:
\ “A user browses products, adds items to the cart, proceeds to checkout, enters shipping information, makes a payment, and receives an order confirmation.”
\ Generated Mermaid Code:
\
graph TD;
    A[User] --> B[Browse Products];
    B --> C[Add Items to Cart];
    C --> D[Proceed to Checkout];
    D --> E[Enter Shipping Information];
    E --> F[Make Payment];
    F --> G[Receive Order Confirmation];
\
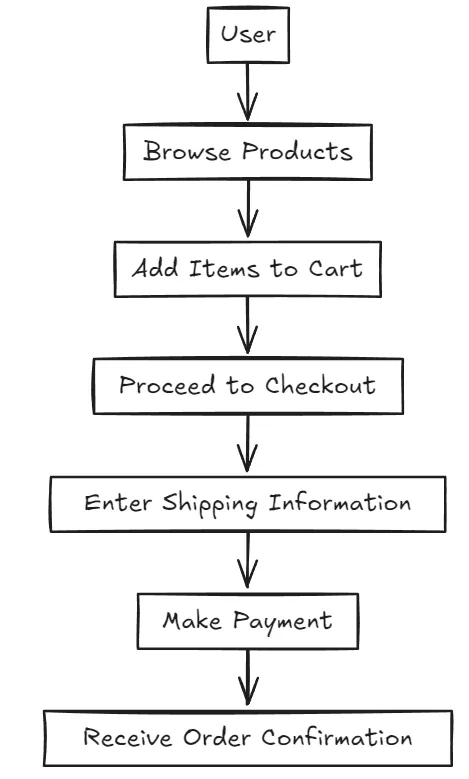
\ This code can be rendered using Mermaid to produce a clear flowchart of the user interaction process.
\ 2. Creating Sequence Diagrams for API Interactions
\ Example:
\ When documenting an API, it’s beneficial to illustrate the sequence of interactions between a client and the server. An LLM can assist by generating a sequence diagram based on a provided description.
\ Description:
\ “A client sends a login request to the server; the server validates credentials, returns an authentication token, and the client receives the token.”
\ Generated Mermaid Code:
sequenceDiagram
    participant Client
    participant Server

    Client->>Server: Login Request
    Server-->>Client: Validate Credentials
    Server-->>Client: Return Authentication Token
    Client-->>Client: Receive Token
\
\
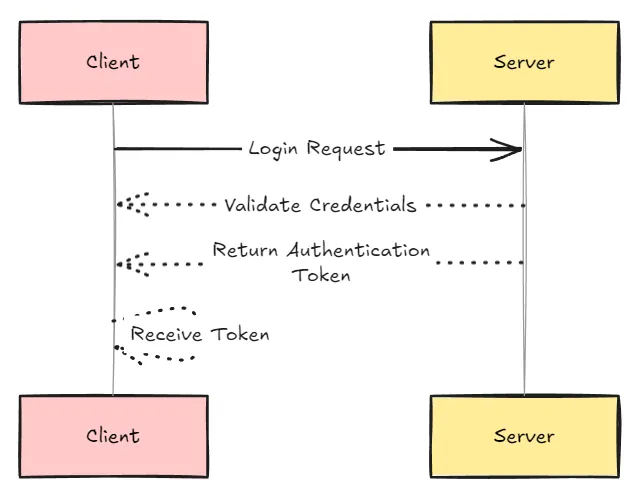
This sequence diagram visually represents the interaction flow between the client and server during the login process.
\ 3. Developing Class Diagrams from Object-Oriented Designs
\ Example:
\ In object-oriented design, class diagrams are essential for visualizing the relationships between different classes. An LLM can generate such diagrams from textual descriptions.
\ Description:
\
“A Car class inherits from a Vehicle class and has attributes like make, model, and year. It also has methods startEngine() and stopEngine()."
\ Generated Mermaid Code:
\
classDiagram
    class Vehicle {
        <<abstract>>
    }
    class Car {
        make
        model
        year
        startEngine()
        stopEngine()
    }
    Vehicle <|-- Ca
\
\
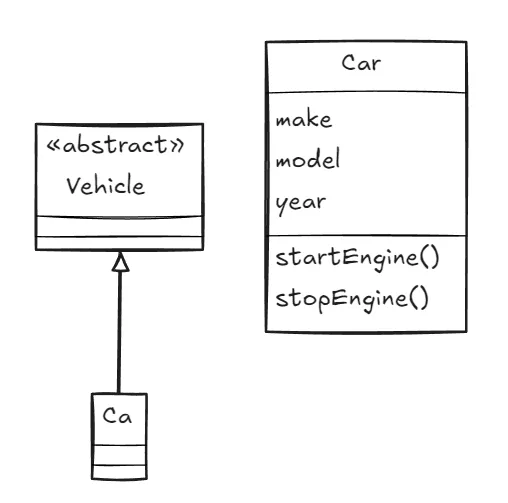
\ \ This class diagram illustrates the inheritance relationship and the structure of the Car class.
\ 4. Visualizing Decision Trees for Business Logic
\ Example:
\ Decision trees are useful for mapping out business logic and decision-making processes. An LLM can generate decision tree diagrams based on detailed descriptions.
\ Description:
\ “If a customer’s purchase amount is over $100, they receive a 10% discount; if they are a loyalty member, they receive an additional 5% discount.”
\ Generated Mermaid Code:
\
graph TD;
    A[Start] --> B{Purchase Amount > $100?};
    B -- Yes --> C[Apply 10% Discount];
    B -- No --> D[No Discount];
    C --> E{Loyalty Member?};
    E -- Yes --> F[Apply Additional 5% Discount];
    E -- No --> G[No Additional Discount];
    D --> H[End];
    F --> H;
    G --> H;
\
\
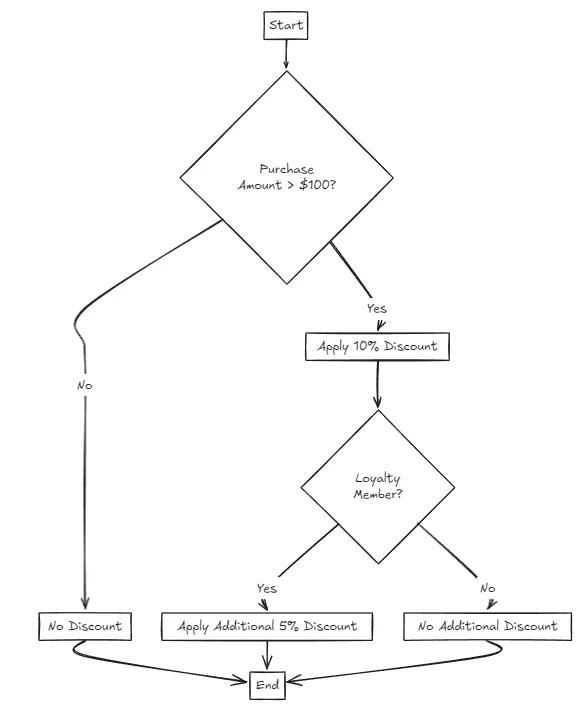
This decision tree diagram helps in understanding the discount application logic for customers.
\ 5. Generating Gantt Charts for Project Planning
\ Example:
\ Project managers can utilize LLMs to create Gantt charts for project timelines based on task descriptions.
\ Description:
\ “Task A starts on January 1st and ends on January 5th; Task B starts on January 6th and ends on January 10th; Task C starts on January 3rd and ends on January 8th.”
\ Generated Mermaid Code:
\
gantt
    dateFormat  YYYY-MM-DD
    title Project Timeline
    section Tasks
    Task A           :a1, 2024-01-01, 5d
    Task B           :a2, 2024-01-06, 5d
    Task C           :a3, 2024-01-03, 6d
\ This Gantt chart provides a visual representation of the project schedule.

\ 6. Visualizing State Machines for System States
\ Example:
\ State machine diagrams are essential for modeling the states and transitions of a system. An LLM can generate these diagrams from textual descriptions.
\ Description:
\ “A traffic light has three states: Red, Green, and Yellow. It transitions from Red to Green, Green to Yellow, and Yellow to Red.”
\ Generated Mermaid Code:
\
stateDiagram
    [*] --> Red
    Red --> Green
    Green --> Yellow
    Yellow --> Red
\
\
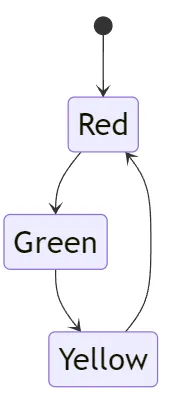
This state diagram depicts the transitions between the different states of a traffic light system.
\ 7. Creating Mind Maps for Brainstorming Sessions
\ Example:
\ Mind maps are useful for organizing ideas during brainstorming sessions. An LLM can assist in generating mind maps from outlined topics.
\ Description:
“The central idea is ‘Software Development’. Main branches include ‘Frontend’, ‘Backend’, ‘DevOps’, and ‘Testing’.”
\ Generated Mermaid Code:
\
mindmap
    root((Software Development))
        Frontend
        Backend
        DevOps
        Testing
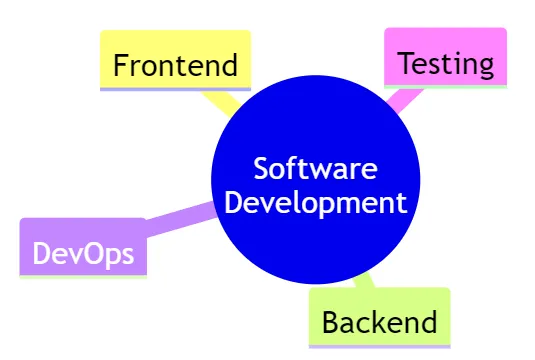
\ \ This mind map provides a visual representation of the main areas in software development.
\ By leveraging LLMs to generate Mermaid and UML diagrams from textual descriptions, developers and project managers can streamline the documentation process, enhance clarity, and improve communication within teams.
\ References :
- https://www.visual-paradigm.com/guide/uml-unified-modeling-language/about-state-diagrams/
- https://drawio-app.com/blog/uml-state-diagrams-with-draw-io/
- https://drawio-app.com/blog/create-uml-sequence-diagrams-in-draw-io/
\
This content originally appeared on HackerNoon and was authored by @uKnowWhoDev
@uKnowWhoDev | Sciencx (2025-01-06T15:18:49+00:00) Learn to Generate Flow Charts With This Simple AI Integration. Retrieved from https://www.scien.cx/2025/01/06/learn-to-generate-flow-charts-with-this-simple-ai-integration/
Please log in to upload a file.
There are no updates yet.
Click the Upload button above to add an update.