
This content originally appeared on DEV Community and was authored by Oki BAYU
Overview
Indonesia is one of the most earthquake-prone countries as it is located within the Pacific Ring of Fire 🔥. Therefore, it is crucial to receive earthquake information quickly and accurately. BMKG (Indonesian Meteorological, Climatological, and Geophysical Agency) provides real-time earthquake data that we can use to build an earthquake monitoring application.
In this article, we will create a simple application to displays the latest earthquake data from BMKG's API and a list of the most recent 15 earthquakes with a magnitude greater than 5.0. The interactive map is powered by Leaflet.
Features
Latest Earthquake Display:
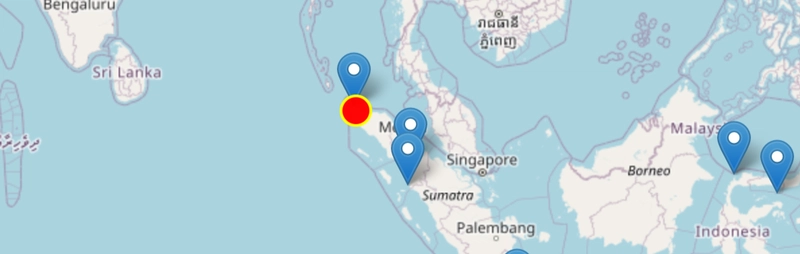
- Shows the most recent earthquake location with a blinking marker.
- Provides details such as region, magnitude, depth, date, and time.
List of Recent Significant Earthquakes:
- Displays the latest 15 earthquakes with a magnitude greater than 5.0.
- Markers are shown on the map, and clicking them reveals earthquake details.
Interactive Map:
- Uses OpenStreetMap as the map layer.
- Markers display earthquake information on click.
- The most recent earthquake marker blinks to draw attention.
Implementation:
Step 1: HTML Structure
First, we create the HTML structure as the foundation of our application. Here’s an example code:
<body>
  <h1>BMKG Latest Earthquake Data</h1>
  <p>Displays the latest earthquake and the list of 15 recent M 5.0+ earthquakes.</p>
  <div id="map" style="width: 100%; height: 500px;"></div>
</body>
Step 2: Styling with CSS
To make the appearance more attractive, we use CSS to create a simple yet informative design.
blink {
  animation: blink-animation 1s infinite;
  color: red;
  font-weight: bold;
}

@keyframes blink-animation {
  0% { opacity: 1; }
  50% { opacity: 0; }
  100% { opacity: 1; }
}

.blink-marker {
  background-color: red;
  border-radius: 50%;
  width: 20px;
  height: 20px;
  animation: blink-animation 1s infinite;
  border: 2px solid yellow;
}
Step 3: Fetching Real-Time Data with JavaScript
To retrieve real-time earthquake data from BMKG's API. We also utilize Leaflet to display an interactive map with the earthquake's location. Here’s how to use JavaScript to fetch the data:
// Import Leaflet from CDN
const leafletCSS = document.createElement("link");
leafletCSS.rel = "stylesheet";
leafletCSS.href = "https://unpkg.com/leaflet@1.7.1/dist/leaflet.css";
document.head.appendChild(leafletCSS);

const leafletScript = document.createElement("script");
leafletScript.src = "https://unpkg.com/leaflet@1.7.1/dist/leaflet.js";
leafletScript.onload = initMap;
document.body.appendChild(leafletScript);

// Function to convert coordinates from BMKG format
function parseCoordinates(coord) {
  const direction = coord.slice(-2);
  const value = parseFloat(coord.slice(0, -2));
  return (direction === "LS" || direction === "BB") ? -value : value;
}

// Initialize Map after Leaflet is loaded
function initMap() {
  fetch("https://data.bmkg.go.id/DataMKG/TEWS/autogempa.json")
    .then(res => res.json())
    .then(latestData => {
      const latest = latestData.Infogempa.gempa;
      const lat = parseCoordinates(latest.Lintang);
      const lon = parseCoordinates(latest.Bujur);

      // Map Initialization
      const map = L.map("map").setView([lat, lon], 5);

      // Adding OpenStreetMap Layer
      L.tileLayer("https://{s}.tile.openstreetmap.org/{z}/{x}/{y}.png", {
        attribution: '© OpenStreetMap contributors'
      }).addTo(map);

      // Blinking Marker for the Latest Earthquake
      const blinkIcon = L.divIcon({
        className: "blink-marker",
        iconSize: [20, 20]
      });

      const latestMarker = L.marker([lat, lon], { icon: blinkIcon }).addTo(map);
      latestMarker.bindPopup(`
        <strong>🌟 Latest Earthquake 🌟</strong><br>
        Region: ${latest.Wilayah}<br>
        Magnitude: ${latest.Magnitude}<br>
        Depth: ${latest.Kedalaman}<br>
        Time: ${latest.Tanggal} ${latest.Jam}
      `);

      // Fetching Recent Earthquakes (Magnitude > 5.0)
      fetch("https://data.bmkg.go.id/DataMKG/TEWS/gempaterkini.json")
        .then(res => res.json())
        .then(recentData => {
          recentData.Infogempa.gempa.forEach(quake => {
            const lat = parseCoordinates(quake.Lintang);
            const lon = parseCoordinates(quake.Bujur);
            const magnitude = parseFloat(quake.Magnitude);

            if (magnitude > 5.0) {
              const marker = L.marker([lat, lon]).addTo(map);
              marker.bindPopup(`
                <strong>${quake.Wilayah}</strong><br>
                Magnitude: ${quake.Magnitude}<br>
                Depth: ${quake.Kedalaman}<br>
                Time: ${quake.Tanggal} ${quake.Jam}
              `);
            }
          });
        })
        .catch(error => console.error("Failed to fetch recent earthquakes:", error));
    })
    .catch(error => console.error("Failed to fetch the latest earthquake:", error));
}
Conclusion
By leveraging data from BMKG and utilizing HTML, CSS, and JavaScript, we can create a simple application to display real-time earthquake information. This application is useful for monitoring seismic activity and raising awareness about potential earthquakes.🫨
You can view the real-time DEMO (in Bahasa) of the application directly below:
I hope this article helps you understand how to build a real-time earthquake monitoring app easily and efficiently!
Happy coding! 😁👍
This content originally appeared on DEV Community and was authored by Oki BAYU
Oki BAYU | Sciencx (2025-03-31T18:05:58+00:00) 🌏 Earthquake Monitoring Dashboard. Retrieved from https://www.scien.cx/2025/03/31/%f0%9f%8c%8f-earthquake-monitoring-dashboard/
Please log in to upload a file.
There are no updates yet.
Click the Upload button above to add an update.