
This content originally appeared on HackerNoon and was authored by Vladislav Agafonov
Every day we hear that “AI is changing the world.” For startup founders, product managers, and engineers, this sounds both like an opportunity and a headache. Where to start? How do you turn a buzzword into real profit?
The truth is that machine learning (ML) is not magic. It is an engineering discipline. Success in applying ML does not depend on choosing the most complex algorithm, but on the ability to formulate the right business question and select the appropriate tool for it.
This article is a practical guide that will help you understand which specific “subfields” of machine learning exist and what concrete business problems each of them solves. We will go through the journey from problem definition to real business results.
Stage 0. Everything starts with a business question
The most common mistake companies make is starting with the question, “How can we use AI?” The right approach is to first ask, “What business problem do we have, and can AI be the most effective solution for it?” This shift in mindset is fundamental for achieving a positive ROI from AI.
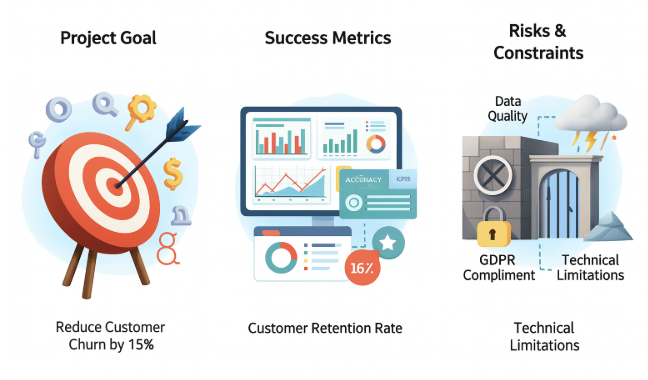
Before starting any ML project, all stakeholders from business leaders to engineers should align on three key aspects:
Project goal: What specific business problem is the model solving? This cannot be a vague goal like “improve user experience.” It should be a measurable task, such as “reduce customer churn by 15% in the next quarter.”
Success metrics: How will we know we’ve achieved the goal? It is necessary to define key performance indicators (KPIs) that directly reflect the business objective. For example, for a model predicting churn, KPIs might include not only technical metrics (such as accuracy) but also business metrics (such as the percentage of at-risk customers retained).
Risks and constraints: What potential obstacles might arise? This includes assessing the availability and quality of data, regulatory requirements (such as GDPR), and technical limitations like computing resources or model response time requirements.
Underestimating this stage creates a vicious cycle of failure. A poorly defined problem (for example, building a regression model to predict a client’s “risk score” when what the business actually needs is a binary “approve/decline” decision) leads to collecting the wrong data, optimizing irrelevant metrics, or deploying a model that, while technically “good” for its (incorrect) task, delivers no business value. This failure, in turn, undermines business trust in the ML team, making it harder to get support for future projects, even when those projects are correctly formulated.
Stage 1. ML task formulation
Before diving into implementation, it’s essential to understand what kind of problem you’re solving and how to frame it in machine learning terms. This step directly determines what type of models, data, and evaluation metrics you’ll use. Let’s break down the three main types of problems that nearly every business encounters.
Supervised Learning
This is the most common and straightforward type of ML. You have historical data with “correct answers,” and you want your model to learn how to find those answers on new data.
Classification: Is it “A” or “B”?
Classification is the task of assigning an object to one of several categories. You “show” the model thousands of labeled examples (for example, emails marked as “spam” and “not spam”). The model learns patterns and is able to determine the category of new, previously unseen emails.
Business applications:
- Churn prediction. Will a customer leave or stay? (Binary classification: Yes/No). This allows the marketing team to focus efforts on retaining at-risk customers.
- Spam detection. Is this email spam?
- Credit scoring. Should a loan be given to a borrower? (Reliable/Risky).
- Medical diagnosis. Are there signs of disease on a scan?
Regression: How much? How many?
Regression is used when you need to predict not a category, but a specific numerical value. The model analyzes the relationships between various factors (for example, house size, neighborhood, number of rooms) and its price based on historical data to learn to predict prices for new houses.
Business applications:
- Demand forecasting. How many units will be sold next month? This helps optimize procurement and inventory.
- LTV estimation (Lifetime Value). What revenue will a customer generate over the entire relationship with the company? This allows you to segment customers and invest more in the most valuable ones.
- Price prediction. What will the price of a stock, product, or airline ticket be in a week?
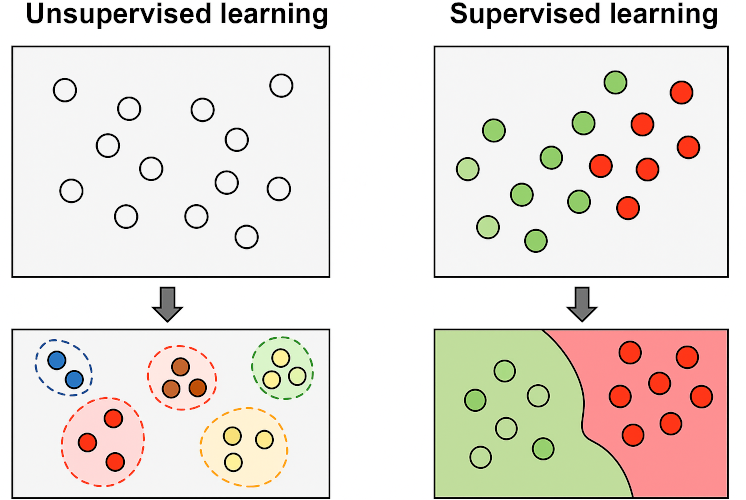
Unsupervised Learning
What if you don’t have data with “correct answers”? This is where unsupervised learning comes in, searching for hidden structures and anomalies in the data.
Clustering: Grouping Similar Objects
Clustering automatically groups similar objects together (into clusters). You might not know what these groups are, but the algorithm will find them. Imagine you pour thousands of different buttons onto a table. A clustering algorithm will group them by size, color, and shape, even if you haven’t given those instructions.
Business applications:
- Customer segmentation. Dividing your customer base into groups with similar behavior (for example, “budget-conscious,” “bargain hunters,” “loyal VIPs”). This allows you to create personalized marketing campaigns.
- Market basket analysis. Which products are often bought together? (For example, beer and chips). This is the basis for recommendation systems and optimizing product placement.
- News grouping. Automatically grouping news articles by topic.
Anomaly Detection: Finding a Needle in a Haystack
This technique is aimed at identifying data that is very different from the norm.
Business applications:
- Fraud detection. Identifying unusual transactions that don’t match typical customer behavior.
- Industrial monitoring. Detecting unusual sensor readings on equipment, which could signal an impending failure.
- Cybersecurity. Detecting abnormal network activity that may indicate an attack.
Deep Learning and LLMs
Deep Learning is not a separate type of task, but rather a powerful set of techniques (based on neural networks) that has taken the solutions to the tasks described above to a new level, especially when working with complex data.
- Image and video recognition. Content moderation, diagnosis from medical images, autonomous driving systems.
- Natural Language Processing (NLP). Sentiment analysis of reviews, chatbots, machine translation.
Large Language Models (LLMs), such as GPT-4, are the latest breakthrough in Deep Learning. They have opened up new horizons for business:
Advanced customer support. Chatbots that not only follow scripts, but understand context and solve real problems.
Content generation. Creating marketing texts, product descriptions, email newsletters.
Document summarization and analysis. Rapid analysis of legal contracts, scientific articles, or internal reports.
Stage 2. Data - the fuel for your ML model
There is one golden rule in the world of machine learning: the quality of your model directly depends on the quality of your data. You can spend weeks fine-tuning the most complex neural network monster, but if it was trained on “garbage,” you’ll get “garbage” out. No wonder that up to 80% of the time in any ML project is spent working with data. This process can be broken down into four key stages.
Collection. Where do you get the data?
The first step is to find the raw material. Modern sources are diverse:
- Open datasets. Platforms like Kaggle or Google Dataset Search are a great starting point for prototyping.
- APIs. Programmatic access to service data (for example, Twitter API) for real-time information.
- Web scraping. Automated collection of information from websites. Powerful, but requires caution from legal and ethical perspectives.
- Internal data. Often, the most valuable asset is the data your company already owns (logs, sales reports, customer data).
- Synthetic data. When real data is scarce or too sensitive, it can be generated artificially, for example, through image augmentation.
Storage. Library, warehouse, or hybrid?
Collected data needs to be stored somewhere, and the choice of architecture is critically important.
- Data Warehouse. This is a “library” for structured, already processed data. Ideal for business intelligence (BI), but inflexible and not well-suited for raw or unstructured data.
- Data Lake. This is a “warehouse” where you can dump absolutely all data in its original format. It offers maximum flexibility for research, but without proper management, quickly turns into a chaotic “data swamp.”
- Data Lakehouse. The newest hybrid approach, aiming to combine the orderliness of a warehouse with the flexibility of a lake. Its goal is to become a unified platform for both BI and ML tasks.
Cleaning. Turning chaos into order
Raw data is almost always messy: it has missing values, errors, duplicates, and outliers. The process of preprocessing brings it to order. Key steps:
- Handling missing values. Removing or filling with mean/median
- Correcting errors and bringing data to a common format
- Normalization. Bringing numerical features to a common scale, so that income in millions doesn’t “drown out” the number of children in the model
- Data labeling. For supervised learning, e.g., marking “cat” and “dog” in photos
Feature Engineering. Creativity and Common Sense
This is perhaps the most important stage. Feature engineering is the art and science of creating new, more informative features from existing data. Instead of feeding the model a raw timestamp, you can create features like dayofweek or is_holiday, which are much more meaningful. A simple algorithm with well-designed features will almost always outperform a complex model with poor ones. 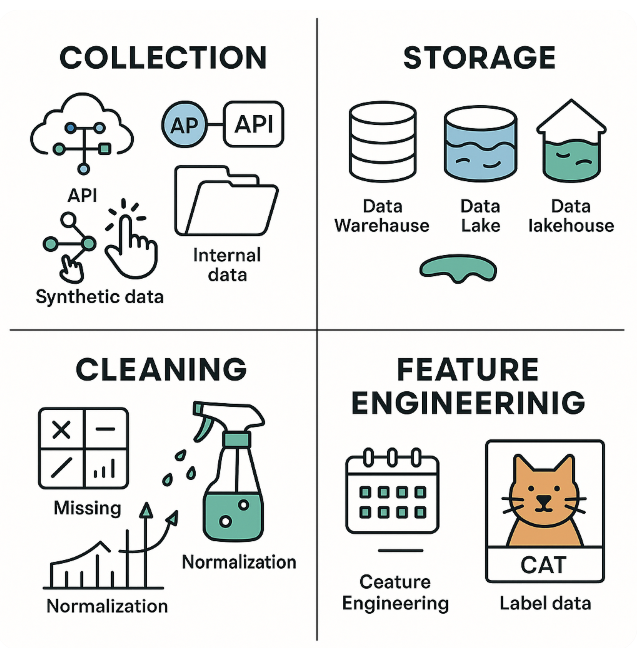
Stage 3. Strategies for Model Comparison
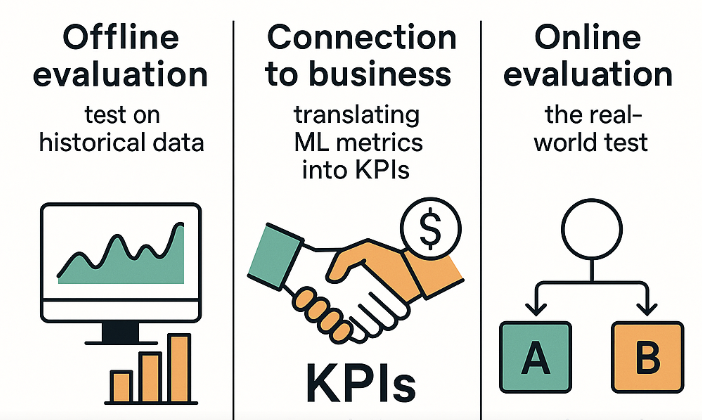
Determining whether a new version of a model (model B) is actually better than the old one (model A) is a multi-level task that goes far beyond simply comparing numbers on a test set. Confidence in the superiority of a new model is built on three pillars: offline evaluation, connection to business metrics, and online testing.
Offline evaluation. Test on historical data
The first and essential step is offline evaluation. Here, we use historical data to measure the model’s quality before deploying it to production. For this, we use technical metrics described in the previous section (Accuracy, F1-score, RMSE, etc.). This stage allows us to filter out obviously poor models and select a few candidates for further, deeper analysis. However, offline metrics do not always reflect the real-world performance of the model, since historical data may not fully correspond to the current situation.
Connection to business. Translating ML metrics into KPIs
Technical metrics such as Precision and Recall say little to the business on their own. To prove the value of the model, they need to be translated into the language of key performance indicators (KPIs). These are quantitative characteristics that show how well the company is achieving its goals.
Let’s consider an example of a customer churn prediction model:
- False Negative (FN). The model predicted that a customer would stay, but they left. For the business, this means losing the entire lifetime value (LTV) of the customer.
- False Positive (FP). The model predicted that a customer would churn, so we offered them a discount to retain them. But in reality, they weren’t going to leave anyway. For the business, this means unnecessary discount costs that reduce profits.
Thus, the choice between optimizing Precision (minimizing FP) and Recall (minimizing FN) directly affects business metrics like LTV (Lifetime Value) and CAC (Customer Acquisition Cost). A successful model should improve the LTV/CAC ratio, demonstrating its economic viability.
Online evaluation. The real-world test
The final verdict on model quality is delivered only after testing it with real users. The gold standard for this is A/B testing.
The A/B testing process for an ML model involves the following steps:
- Hypothesis formulation and metric selection. First, a clear hypothesis is defined. For example: “The new recommendation model (version B) will increase the average order value (AOV) by 5% compared to the old model (version A).” Both technical metrics (accuracy, response speed) and, more importantly, product and business metrics (CTR, conversion, AOV, LTV) are selected as evaluation criteria.
- Traffic splitting. Users are randomly divided into two groups. Group A (control) continues to interact with the old model, and group B (test) with the new one.
- Running the experiment. The test is run for a specified period (e.g., two weeks), during which behavioral data from both groups is collected.
- Result analysis. After the test ends, the collected data is analyzed using statistical methods (such as t-tests) to determine whether the difference in metrics between the groups is statistically significant.
- Decision making. If the new model (B) demonstrates a statistically significant improvement in key business metrics, a decision is made to roll it out to all users. If not, the system is rolled back to the previous version (A).
Only by going through all three stages from offline comparison to a successful A/B test proving positive impact on business KPIs can you confidently say that the new model is truly better.
Stage 4. From lab to real world
So, you've built a model with excellent offline metrics. The journey from Jupyter Notebook to a product that delivers real value is exactly where most ML projects fail. This is where engineering discipline steps in. For your model to be reproducible, safe, and effective in the long run, you need to master three critical areas: logging, deployment, and monitoring.
Logging. The “Black Box” of Your ML Experiments
Developing ML models is inherently experimental. Without a strict logging system, it turns into chaos. You’re left wondering: “Wait, which data version gave me an F1-score of 0.92? Was that before or after I changed the learning rate?”
Logging is your single source of truth. Here’s why it’s crucial and what you need to track.
Why this is non-negotiable:
- Reproducibility.So that any team member (including your future self) can exactly reproduce a result.
- Comparison. To objectively compare models and understand exactly what change led to an improvement or regression.
- Debugging. When the model starts behaving strangely, logs are your best and first tool for finding the root cause.
Must-have log for every run:
- All hyperparameters (learningrate, treedepth, etc.).
- Metrics and results of the experiment (F1-score, RMSE, accuracy, etc.).
- Code version: Git commit hash
- Dataset hash. Absolutely critical. Tools like DVC are made for this.
- The actual results: serialized model (model.pkl), plots (confusion matrix, ROC curve), and any data profiles.
- Environment. Snapshot of your dependencies, usually as a requirements.txt or conda.yml file.
To avoid routine work, use specialized tools. MLflow, for example, offers a convenient API for logging all of this, and its autologging features are a lifesaver, automatically saving most of this information with a single line of code.
Deployment. Don’t Break Production
Rolling out a new, “improved” model to 100% of users right away is reckless. A model that worked perfectly in isolation can collapse under real-world load or cause unforeseen negative effects. Use proven strategies to mitigate launch risks.
Strategy 1. Shadow Deployment
Think of this as a full dress rehearsal without an audience. The new model is deployed in parallel with the old (production) model. Incoming user traffic is duplicated and sent to both models. The old model still serves the user responses. The new, “shadow” model’s responses are not shown to users, they’re quietly logged for analysis.
Strategy 2. Canary Release
Named after the canaries miners used to detect toxic gases, this strategy lets you “test the waters” safely. The new model is rolled out to a tiny fraction of users - the “canaries” (for example, 1–5%). The remaining 95–99% continue to use the old, stable model. If everything looks good in the “canary” group (both technically and business-wise), you gradually increase the traffic share: 10%, 25%, 50%, and finally 100%. If problems arise at any stage, you immediately roll traffic back to the old model.
Post-Launch monitoring
Your job isn’t done after deployment. In fact, it’s only just begun. Every model degrades over time, because the real world beneath it keeps changing. This phenomenon is called model drift, and ignoring it is a recipe for quiet failure.
There are two main types of drift you must watch for:
Data Drift.
Occurs when the statistical properties of input data change. Data drift means a change in the distribution of the model’s input data. Example: A credit scoring model was trained on data where the average borrower age was 35. A year later, a new marketing campaign brings in a flood of applications from young, 22-year-old graduates. The distribution for the age feature has “drifted.” The model’s performance on this new demographic may be unreliable, as it is seeing data it was never trained on.
Concept Drift.
This is a deeper shift, where the relationship between input data and the target variable changes. Concept drift means a change in the relationship between input variables and what you are trying to predict. Example: During an economic crisis, buyer behavior changes. A customer with the same income and age who used to be a reliable buyer may now be extremely price-sensitive. The “rules of the game” have changed. The patterns the model learned are no longer valid, even if the input data looks similar.
Systematic monitoring for both types of drift is the cornerstone of MLOps. It’s the alarm bell telling you your model is outdated. When it rings, it’s time to go back to the lab, retrain the model on fresh, relevant data, and redeploy it so it continues to bring value.
Conclusion
We have traced the entire journey from an abstract business idea to a complex, trackable, and value-generating AI system running in production. The nervous system of this whole process is the ML pipeline. It turns disconnected steps into a unified, automated, and reliable mechanism.
This journey clearly demonstrates how the role of a machine learning engineer has changed. Today, this is no longer just a specialist building models in a Jupyter notebook. The modern ML engineer is a systems architect, data strategy expert, and operations specialist. They must understand the business context, design data architectures, build reliable and reproducible pipelines, and take responsibility for the ethical and stable functioning of their systems in the real world.
Mastering the principles and practices described in this guide, from problem formulation and data handling to deployment, monitoring, and implementing advanced paradigms such as MLOps and Responsible AI is the key to success in this complex, yet incredibly exciting field.
Follow me
This content originally appeared on HackerNoon and was authored by Vladislav Agafonov
Vladislav Agafonov | Sciencx (2025-06-30T01:25:27+00:00) A Practical Guide to Machine Learning for Business. Retrieved from https://www.scien.cx/2025/06/30/a-practical-guide-to-machine-learning-for-business/
Please log in to upload a file.
There are no updates yet.
Click the Upload button above to add an update.