
This content originally appeared on HackerNoon and was authored by AB Test
Table of Links
Hypothesis testing
2.5 Optional Stopping and Peeking
Safe Tests
Safe Testing Simulations
4.1 Introduction and 4.2 Python Implementation
Mixture sequential probability ratio test
7 Vinted A/B tests
Vinted is an online marketplace for clothing and accessories. Since its inception in 2008, it has gained over 75 million users to rapidly develop into Europe’s largest secondhand clothing marketplace. With such an abundance of users, it conducts a large number of A/B tests simultaneously to deliver the best experience for its users. This makes Vinted an ideal environment to evaluate the efficacy of safe tests. In this section, we apply the safe t-test and the safe proportion tests to Vinted’s experiment data. The safe t-test will be compared to the classical t-test to evaluate the results of A/B tests. In addition, the safe proportion test will be compared to χ2 test as a means to detect the sample ratio mismatch of experiments.
7.1 Safe t-test for Vinted A/B tests
The metrics for 162 Vinted experiments from March 2023 to June 2023 will be evaluated for this analysis. We collated cumulative daily snapshots of 143 metrics, containing the metric’s mean, standard deviation, and sample size for both control and test groups. Experiments with multiple variants are treated as separate tests with the same control group. The safe t-test and the classical t-test were compared across all 42115 experiment/metric combinations in this dataset. Table 7 shows the results of the statistical tests at level α = 0.05.
\
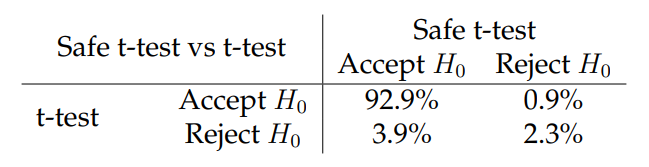
\ The results of Table 7 show that the safe t-test and the classical t-test consistently reach the same conclusion about the significance of the metrics. The 379 cases in which the safe t-test rejects an H0 that the t-test does not are consistent with the simulations demonstrating that the tests do not always agree on what constitutes a significant result. The high number of 1645 cases in which the t-test rejects H0 while the safe t-test does not are more concerning. The safe t-test is more sensitive when it observes data sequentially, giving more opportunities to reject H0. These data are aggregated on a daily level, which effectively reduces the power of the test. With more granular data, the safe t-test would detect more effects than in this group-sequential setting.
\ The mixture sequential probability ratio test (mSPRT) was conducted on the same set of experiments. The results can be found in Table 8.
\ Comparing the results of Table 8 with Table 7 show that the mSPRT is significantly less
\
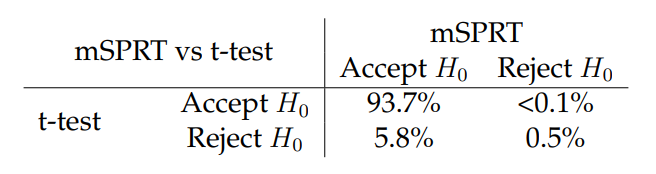
\ powerful than the safe t-test. While this is in part due to the group-sequential setting, our simulation results suggest that the mSPRT is simply a less sensitive statistical test than the safe t-test.
\ Returning to the safe t-test results, it was found that the safe t-test performed significantly better on some metrics than others. Here, we will further analyze the metrics to understand why this is the case. To quantify the safe t-test’s performance on a metric, we use the phi coefficient to compare its decisions with the classical t-test. The phi coefficient, also known as Matthews correlation coefficient, is used to determine the correlation of binary variables. To understand the purpose of each metric, there is a text description of its use case within Vinted’s A/B testing framework. A summary of the topics in each description can be extracted with Latent Dirichlet Allocation. Latent Dirichlet allocation (LDA) is a natural language processing technique for modelling the topics from a set of documents. In this case, LDA is used to extract the topics from the metric descriptions in the form of latent vectors. We multiply the latent vectors by the phi coefficient to find the average phi coefficient for each topic. Table 9 shows words that are correlated with higher and lower phi coefficients.
\
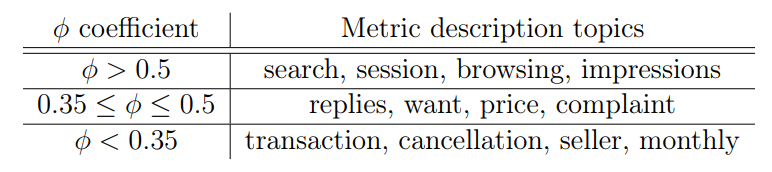
\ In the introduction to A/B testing, it was mentioned that some metrics take much longer to be realized. This means that the data will not be independent and identically distributed across the days of the test. Examining Table 9, we see a high correlation between the performance of the safe t-test and the classical t-test on metrics involving searches, sessions, and impressions. These are all quantities that have a short time between exposure to the test and the realization of the metric. Conversely, the safe t-test does not perform well on long-term metrics involving transactions and order cancellations. Together, these results suggest that the safe t-test will perform optimally on metrics for which results are available instantaneously.
7.2 Safe proportion test for sample ratio mismatch
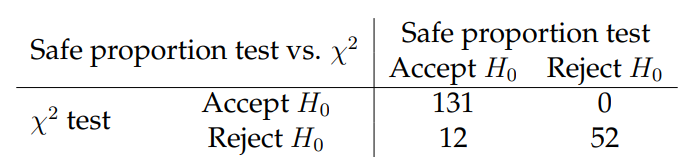
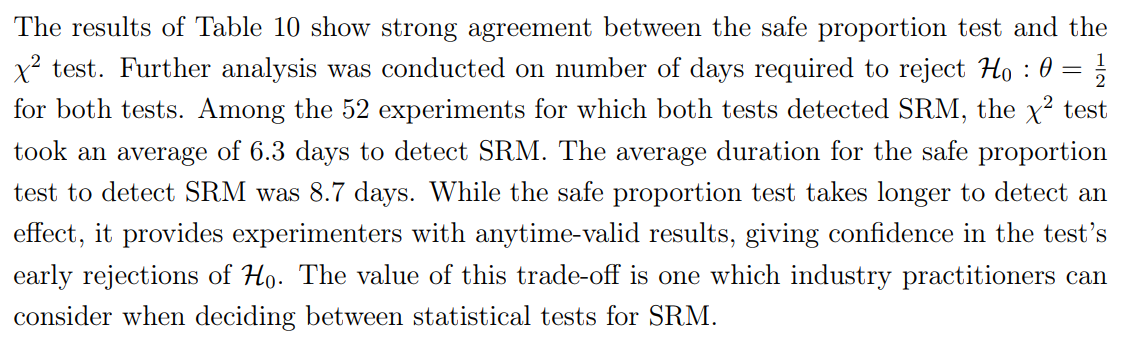
To determine the efficacy of the safe proportion test and the χ2 test in detecting sample ratio mismatch (SRM), the distributions of 195 experiments from Vinted are analyzed. The safe test is applied to daily snapshots of the distributions, while the χ2 test is applied to the distribution on the final day of the experiment. For SRM, a significance level of α = 0.01 is used to limit the number of false positives. Beta prior values of α1, β1 = 1000 are used for the safe proportion test. The comparison of the results between the safe proportion test and the χ 2 test can be seen in Table 10.
\
\
\
\
\
\ \ \
:::info Author:
(1) Daniel Beasley
:::
:::info This paper is available on arxiv under ATTRIBUTION-NONCOMMERCIAL-SHAREALIKE 4.0 INTERNATIONAL license.
:::
\
This content originally appeared on HackerNoon and was authored by AB Test
AB Test | Sciencx (2025-08-12T06:00:08+00:00) What 162 Vinted A/B Tests Reveal About Your Conversion Metrics. Retrieved from https://www.scien.cx/2025/08/12/what-162-vinted-a-b-tests-reveal-about-your-conversion-metrics/
Please log in to upload a file.
There are no updates yet.
Click the Upload button above to add an update.