
This content originally appeared on HackerNoon and was authored by Tensor Flow - [Technical Documentation]
Content Overview
- Collect performance data
- Profiling APIs
- Profiling custom training loops
- Profiling use cases
- Best practices for optimal model performance
- Optimize the input data pipeline
- Use threading and parallel execution
- Miscellaneous
- Improve device performance
- Additional resources
- Known limitations
- Profiling multiple GPUs on TensorFlow 2.2 and TensorFlow 2.3
\
Collect performance data
The TensorFlow Profiler collects host activities and GPU traces of your TensorFlow model. You can configure the Profiler to collect performance data through either the programmatic mode or the sampling mode.
Profiling APIs
You can use the following APIs to perform profiling.
- Programmatic mode using the TensorBoard Keras Callback (
tf.keras.callbacks.TensorBoard)
\
# Profile from batches 10 to 15
tb_callback = tf.keras.callbacks.TensorBoard(log_dir=log_dir,
                                             profile_batch='10, 15')

# Train the model and use the TensorBoard Keras callback to collect
# performance profiling data
model.fit(train_data,
          steps_per_epoch=20,
          epochs=5,
          callbacks=[tb_callback])
\
- Programmatic mode using the
tf.profilerFunction API
\
tf.profiler.experimental.start('logdir')
# Train the model here
tf.profiler.experimental.stop()
\
- Programmatic mode using the context manager
\
with tf.profiler.experimental.Profile('logdir'):
    # Train the model here
    pass
\
:::tip Note: Running the Profiler for too long can cause it to run out of memory. It is recommended to profile no more than 10 steps at a time. Avoid profiling the first few batches to avoid inaccuracies due to initialization overhead.
:::
\
Sampling mode: Perform on-demand profiling by using
tf.profiler.experimental.server.startto start a gRPC server with your TensorFlow model run. After starting the gRPC server and running your model, you can capture a profile through the Capture Profile button in the TensorBoard profile plugin. Use the script in the Install profiler section above to launch a TensorBoard instance if it is not already running.As an example,
\
# Start a profiler server before your model runs.
tf.profiler.experimental.server.start(6009)
# (Model code goes here).
#  Send a request to the profiler server to collect a trace of your model.
tf.profiler.experimental.client.trace('grpc://localhost:6009',
                                      'gs://your_tb_logdir', 2000)
An example for profiling multiple workers:
\
# E.g., your worker IP addresses are 10.0.0.2, 10.0.0.3, 10.0.0.4, and you
# would like to profile for a duration of 2 seconds.
tf.profiler.experimental.client.trace(
    'grpc://10.0.0.2:8466,grpc://10.0.0.3:8466,grpc://10.0.0.4:8466',
    'gs://your_tb_logdir',
    2000)
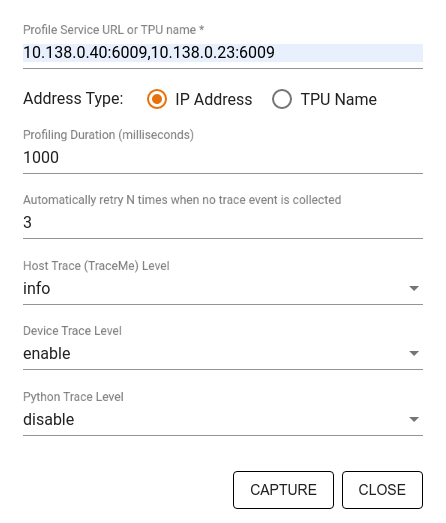
Use the Capture Profile dialog to specify:
- A comma-delimited list of profile service URLs or TPU names.
- A profiling duration.
- The level of device, host, and Python function call tracing.
- How many times you want the Profiler to retry capturing profiles if unsuccessful at first.
Profiling custom training loops
To profile custom training loops in your TensorFlow code, instrument the training loop with the tf.profiler.experimental.Trace API to mark the step boundaries for the Profiler.
The name argument is used as a prefix for the step names, the step_num keyword argument is appended in the step names, and the _r keyword argument makes this trace event get processed as a step event by the Profiler.
As an example,
\
for step in range(NUM_STEPS):
    with tf.profiler.experimental.Trace('train', step_num=step, _r=1):
        train_data = next(dataset)
        train_step(train_data)
This will enable the Profiler's step-based performance analysis and cause the step events to show up in the trace viewer.
Make sure that you include the dataset iterator within the tf.profiler.experimental.Trace context for accurate analysis of the input pipeline.
The code snippet below is an anti-pattern:
\
:::warning Warning: This will result in inaccurate analysis of the input pipeline.
:::
\
for step, train_data in enumerate(dataset):
    with tf.profiler.experimental.Trace('train', step_num=step, _r=1):
        train_step(train_data)
Profiling use cases
The profiler covers a number of use cases along four different axes. Some of the combinations are currently supported and others will be added in the future. Some of the use cases are:
- Local vs. remote profiling: These are two common ways of setting up your profiling environment. In local profiling, the profiling API is called on the same machine your model is executing, for example, a local workstation with GPUs. In remote profiling, the profiling API is called on a different machine from where your model is executing, for example, on a Cloud TPU.
- Profiling multiple workers: You can profile multiple machines when using the distributed training capabilities of TensorFlow.
- Hardware platform: Profile CPUs, GPUs, and TPUs.
The table below provides a quick overview of the TensorFlow-supported use cases mentioned above:
| Profiling API | Local | Remote | Multiple workers | Hardware Platforms |
|----|----|----|----|----|
| TensorBoard Keras Callback | Supported | Not Supported | Not Supported | CPU, GPU |
| tf.profiler.experimental start/stop API | Supported | Not Supported | Not Supported | CPU, GPU |
| tf.profiler.experimental client.trace API | Supported | Supported | Supported | CPU, GPU, TPU |
| Context manager API | Supported | Not supported | Not Supported | CPU, GPU |
\
Best practices for optimal model performance
Use the following recommendations as applicable for your TensorFlow models to achieve optimal performance.
In general, perform all transformations on the device and ensure that you use the latest compatible version of libraries like cuDNN and Intel MKL for your platform.
Optimize the input data pipeline
Use the data from the [#inputpipelineanalyzer] to optimize your data input pipeline. An efficient data input pipeline can drastically improve the speed of your model execution by reducing device idle time. Try to incorporate the best practices detailed in the Better performance with the tf.data API guide and below to make your data input pipeline more efficient.
- In general, parallelizing any ops that do not need to be executed sequentially can significantly optimize the data input pipeline.
- In many cases, it helps to change the order of some calls or to tune the arguments such that it works best for your model. While optimizing the input data pipeline, benchmark only the data loader without the training and backpropagation steps to quantify the effect of the optimizations independently.
- Try running your model with synthetic data to check if the input pipeline is a performance bottleneck.
- Use
tf.data.Dataset.shardfor multi-GPU training. Ensure you shard very early on in the input loop to prevent reductions in throughput. When working with TFRecords, ensure you shard the list of TFRecords and not the contents of the TFRecords. - Parallelize several ops by dynamically setting the value of
num_parallel_callsusingtf.data.AUTOTUNE. - Consider limiting the usage of
tf.data.Dataset.from_generatoras it is slower compared to pure TensorFlow ops. - Consider limiting the usage of
tf.py_functionas it cannot be serialized and is not supported to run in distributed TensorFlow. - Use
tf.data.Optionsto control static optimizations to the input pipeline.
Also read the tf.data performance analysis guide for more guidance on optimizing your input pipeline.
Optimize data augmentation
When working with image data, make your data augmentation more efficient by casting to different data types after applying spatial transformations, such as flipping, cropping, rotating, etc.
\
:::tip
Note: Some ops like tf.image.resize transparently change the dtype to fp32. Make sure you normalize your data to lie between 0 and 1 if it's not done automatically. Skipping this step could lead to NaN errors if you have enabled AMP.
:::
| | |----|
Use NVIDIA® DALI
In some instances, such as when you have a system with a high GPU to CPU ratio, all of the above optimizations may not be enough to eliminate bottlenecks in the data loader caused due to limitations of CPU cycles.
If you are using NVIDIA® GPUs for computer vision and audio deep learning applications, consider using the Data Loading Library (DALI) to accelerate the data pipeline.
Check the NVIDIA® DALI: Operations documentation for a list of supported DALI ops.
Use threading and parallel execution
Run ops on multiple CPU threads with the tf.config.threading API to execute them faster.
TensorFlow automatically sets the number of parallelism threads by default. The thread pool available for running TensorFlow ops depends on the number of CPU threads available.
Control the maximum parallel speedup for a single op by using tf.config.threading.set_intra_op_parallelism_threads. Note that if you run multiple ops in parallel, they will all share the available thread pool.
If you have independent non-blocking ops (ops with no directed path between them on the graph), use tf.config.threading.set_inter_op_parallelism_threads to run them concurrently using the available thread pool.
Miscellaneous
When working with smaller models on NVIDIA® GPUs, you can set tf.compat.v1.ConfigProto.force_gpu_compatible=True to force all CPU tensors to be allocated with CUDA pinned memory to give a significant boost to model performance. However, exercise caution while using this option for unknown/very large models as this might negatively impact the host (CPU) performance.
Improve device performance
Follow the best practices detailed here and in the GPU performance optimization guide to optimize on-device TensorFlow model performance.
If you are using NVIDIA GPUs, log the GPU and memory utilization to a CSV file by running:
\
nvidia-smi
--query-gpu=utilization.gpu,utilization.memory,memory.total,
memory.free,memory.used --format=csv
Configure data layout
When working with data that contains channel information (like images), optimize the data layout format to prefer channels last (NHWC over NCHW).
Channel-last data formats improve Tensor Core utilization and provide significant performance improvements especially in convolutional models when coupled with AMP. NCHW data layouts can still be operated on by Tensor Cores, but introduce additional overhead due to automatic transpose ops.
You can optimize the data layout to prefer NHWC layouts by setting data_format="channels_last" for layers such as tf.keras.layers.Conv2D, tf.keras.layers.Conv3D, and tf.keras.layers.RandomRotation.
Use tf.keras.backend.set_image_data_format to set the default data layout format for the Keras backend API.
Max out the L2 cache
When working with NVIDIA® GPUs, execute the code snippet below before the training loop to max out the L2 fetch granularity to 128 bytes.
\
import ctypes

_libcudart = ctypes.CDLL('libcudart.so')
# Set device limit on the current device
# cudaLimitMaxL2FetchGranularity = 0x05
pValue = ctypes.cast((ctypes.c_int*1)(), ctypes.POINTER(ctypes.c_int))
_libcudart.cudaDeviceSetLimit(ctypes.c_int(0x05), ctypes.c_int(128))
_libcudart.cudaDeviceGetLimit(pValue, ctypes.c_int(0x05))
assert pValue.contents.value == 128
Configure GPU thread usage
The GPU thread mode decides how GPU threads are used.
Set the thread mode to gpu_private to make sure that preprocessing does not steal all the GPU threads. This will reduce the kernel launch delay during training. You can also set the number of threads per GPU. Set these values using environment variables.
\
import os

os.environ['TF_GPU_THREAD_MODE']='gpu_private'
os.environ['TF_GPU_THREAD_COUNT']='1'
Configure GPU memory options
In general, increase the batch size and scale the model to better utilize GPUs and get higher throughput. Note that increasing the batch size will change the model’s accuracy so the model needs to be scaled by tuning hyperparameters like the learning rate to meet the target accuracy.
Also, use tf.config.experimental.set_memory_growth to allow GPU memory to grow to prevent all the available memory from being fully allocated to ops that require only a fraction of the memory. This allows other processes which consume GPU memory to run on the same device.
To learn more, check out the Limiting GPU memory growth guidance in the GPU guide to learn more.
Miscellaneous
- Increase the training mini-batch size (number of training samples used per device in one iteration of the training loop) to the maximum amount that fits without an out of memory (OOM) error on the GPU. Increasing the batch size impacts the model's accuracy—so make sure you scale the model by tuning hyperparameters to meet the target accuracy.
- Disable reporting OOM errors during tensor allocation in production code. Set
report_tensor_allocations_upon_oom=Falseintf.compat.v1.RunOptions. - For models with convolution layers, remove bias addition if using batch normalization. Batch normalization shifts values by their mean and this removes the need to have a constant bias term.
- Use TF Stats to find out how efficiently on-device ops run.
- Use
tf.functionto perform computations and optionally, enable thejit_compile=Trueflag (tf.function(jit_compile=True). To learn more, go to Use XLA tf.function. - Minimize host Python operations between steps and reduce callbacks. Calculate metrics every few steps instead of at every step.
- Keep the device compute units busy.
- Send data to multiple devices in parallel.
- Consider using 16-bit numerical representations, such as
fp16—the half-precision floating point format specified by IEEE—or the Brain floating-point bfloat16 format.
Additional resources
- The TensorFlow Profiler: Profile model performance tutorial with Keras and TensorBoard where you can apply the advice in this guide.
- The Performance profiling in TensorFlow 2 talk from the TensorFlow Dev Summit 2020.
- The TensorFlow Profiler demo from the TensorFlow Dev Summit 2020.
Known limitations
Profiling multiple GPUs on TensorFlow 2.2 and TensorFlow 2.3
TensorFlow 2.2 and 2.3 support multiple GPU profiling for single host systems only; multiple GPU profiling for multi-host systems is not supported. To profile multi-worker GPU configurations, each worker has to be profiled independently. From TensorFlow 2.4 multiple workers can be profiled using the tf.profiler.experimental.client.trace API.
CUDA® Toolkit 10.2 or later is required to profile multiple GPUs. As TensorFlow 2.2 and 2.3 support CUDA® Toolkit versions only up to 10.1, you need to create symbolic links to libcudart.so.10.1 and libcupti.so.10.1:
\
sudo ln -s /usr/local/cuda/lib64/libcudart.so.10.2 /usr/local/cuda/lib64/libcudart.so.10.1
sudo ln -s /usr/local/cuda/extras/CUPTI/lib64/libcupti.so.10.2 /usr/local/cuda/extras/CUPTI/lib64/libcupti.so.10.1
\ \
:::info Originally published on the TensorFlow website, this article appears here under a new headline and is licensed under CC BY 4.0. Code samples shared under the Apache 2.0 License.
:::
\
This content originally appeared on HackerNoon and was authored by Tensor Flow - [Technical Documentation]
Tensor Flow - [Technical Documentation] | Sciencx (2025-08-13T07:00:07+00:00) How to Use TensorFlow Profiler to Optimize Model Performance. Retrieved from https://www.scien.cx/2025/08/13/how-to-use-tensorflow-profiler-to-optimize-model-performance/
Please log in to upload a file.
There are no updates yet.
Click the Upload button above to add an update.