
This content originally appeared on HackerNoon and was authored by Market Crash
Table of Links
III. TDA Approach to analyzing multiple time series
A. Obtaining point cloud from stock price time-series
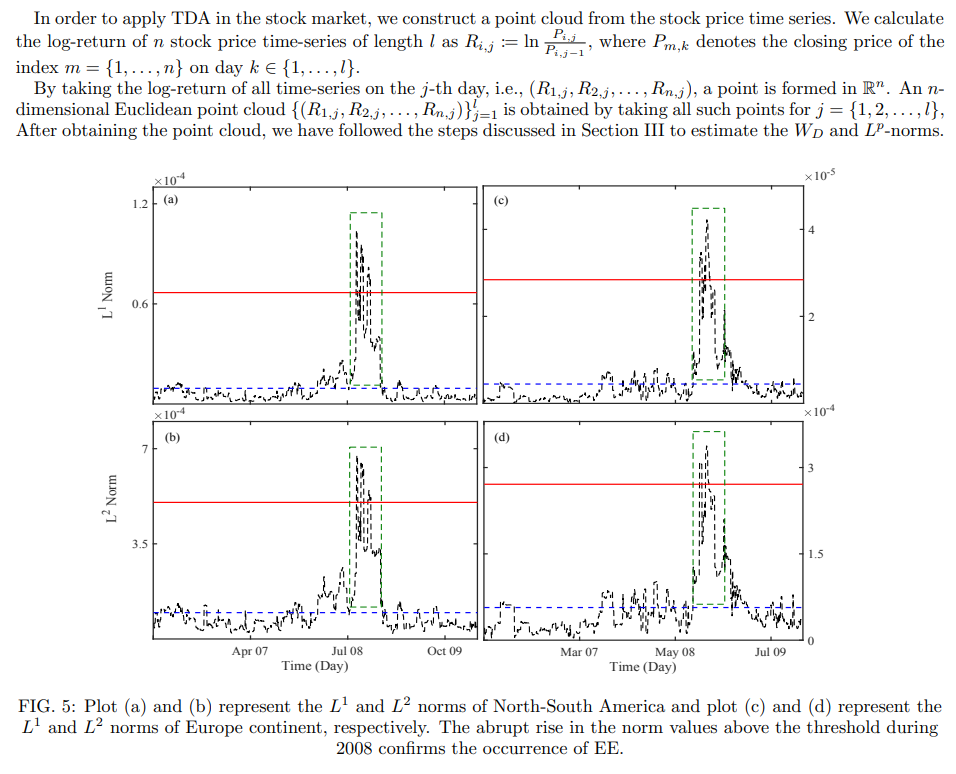
B. EE due to the 2008 Financial crisis
C. EE due to COVID-19 pandemic
D. Impact of COVID-19 on different Indian sectors
VII. Acknowledgments and References
A. Obtaining point cloud from stock price time-series
\
:::info Authors:
(1) Anish Rai, Department of Physics, National Institute of Technology Sikkim, Sikkim, India-737139;
(2) Buddha Nath Sharma, Department of Physics, National Institute of Technology Sikkim, Sikkim, India-737139;
(3) Salam Rabindrajit Luwang, Department of Physics, National Institute of Technology Sikkim, Sikkim, India-737139;
(4) Md.Nurujjaman, Department of Physics, National Institute of Technology Sikkim, Sikkim, India-737139;
(5) Sushovan Majhi, Data Science Program, George Washington University, USA, 20052.
:::
:::info This paper is available on arxiv under CC BY 4.0 DEED license.
:::
\
This content originally appeared on HackerNoon and was authored by Market Crash
Market Crash | Sciencx (2025-08-29T01:46:07+00:00) Identifying Extreme Events: A Stock Market Case Study of North America and Europe. Retrieved from https://www.scien.cx/2025/08/29/identifying-extreme-events-a-stock-market-case-study-of-north-america-and-europe/
Please log in to upload a file.
There are no updates yet.
Click the Upload button above to add an update.