
This content originally appeared on Level Up Coding - Medium and was authored by Jian Ruan

For many, understanding how LLMs work isn’t as straightforward as reading through math formulas. While a strong math foundation is valuable, equations alone often fail to convey the deeper intuition behind these models. Instead of getting lost in abstract notation, I find that visualizations and interactive tools offer a much clearer way to grasping core ideas before diving into the details.
The real challenge isn’t just understanding the math — it’s about building an intuitive sense of why these models recognize patterns, generate coherent responses, and even seem to reason. Visual representations can bridge the gap between complex theory and practical understanding — because at the end of the day, it all boils down to matrix multiplication.
Here are some of the best visual resources I’ve found that help build a deep, intuitive understanding of LLMs.
3Blue1Brown —Understanding Transformers Through Math-Driven Animations
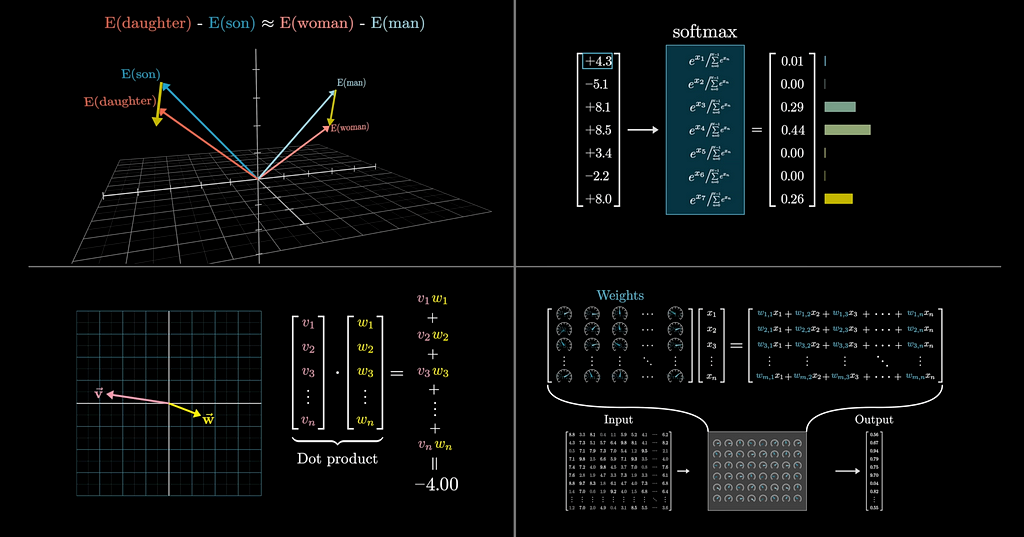
I’ve always been amazed by how Grant Sanderson (aka 3Blue1Brown) turns abstract math concepts into something visually intuitive and elegant. His neural network series, particularly the transformer breakdown, is one of the best visual explanations out there [1]. He walks through concepts like gradient descent, back-propagation, and attention mechanisms in a way that just clicks. Plus, his other videos on linear algebra and probability are worth checking out — they provide a strong foundation for understanding the math behind these models.
Brendan Bycroft ‘s 3D Transformer Visualization
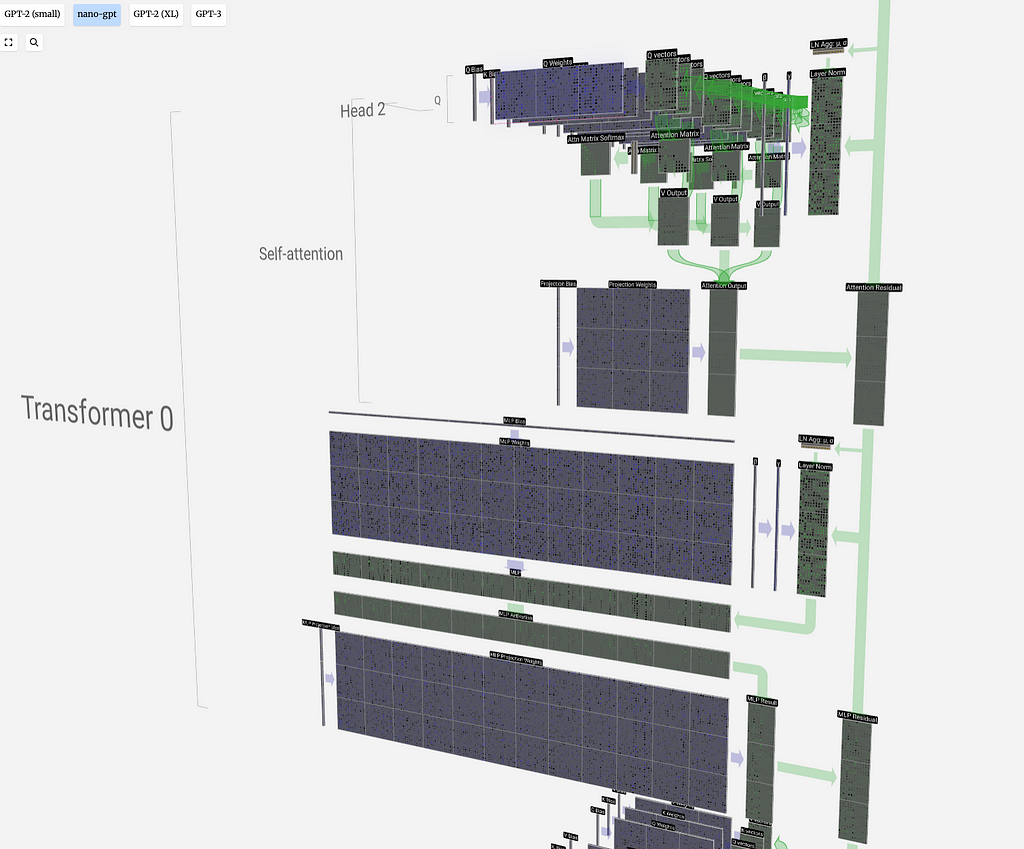
Software engineer Brendan Bycroft has created an incredible 3D visualization of GPT like transformer models [2]. His interactive tool lets you zoom, rotate, and explore a transformer model, like you’re peeling down a neural network layer by layer.
What I love about this tool is how it walks you through the entire model architecture step by step. Instead of staring at abstract block diagrams, you can literally explore how attention layers, MLPs, and other components stack together. It gives you a big-picture view while also letting you zoom in on the computation happening inside — hover over each dot in the matrix, and you can see the calculations happening at different stages.
You can even compare different model sizes, from nanoGPT to much larger architectures like GPT-3 [3]. Scaling up feels like copy-pasting the same modular building blocks, which reinforces the idea that these models grow by stacking more of the same fundamental units. If you want to build an intuitive, almost Lego-like mental model of transformers, this is a fantastic place to start.
Basil Hosmer’s Matrix Multiplication Visualizer (mm)
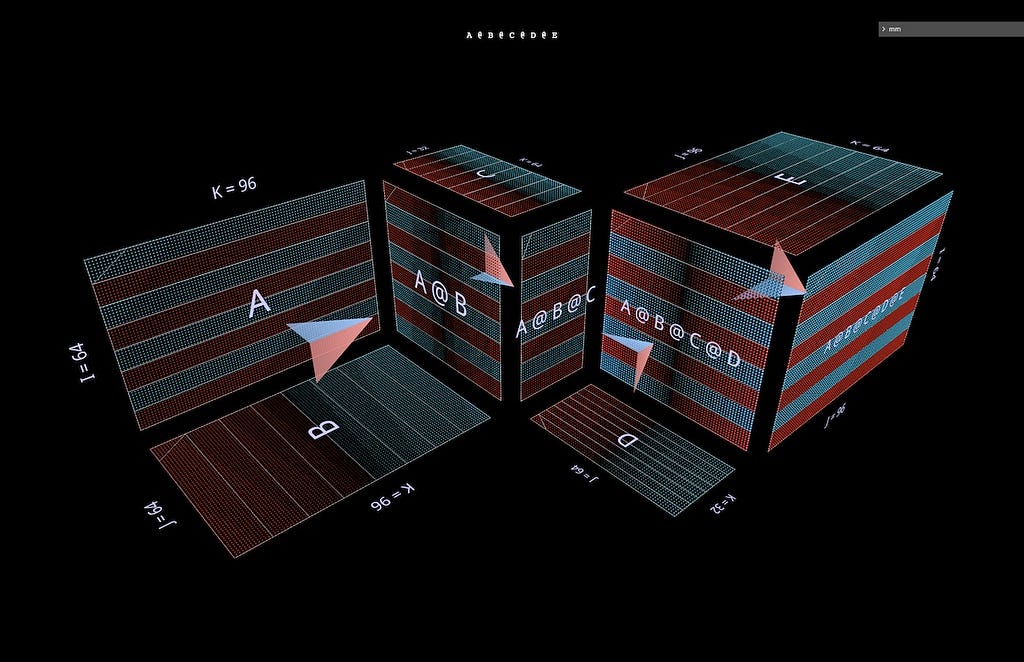
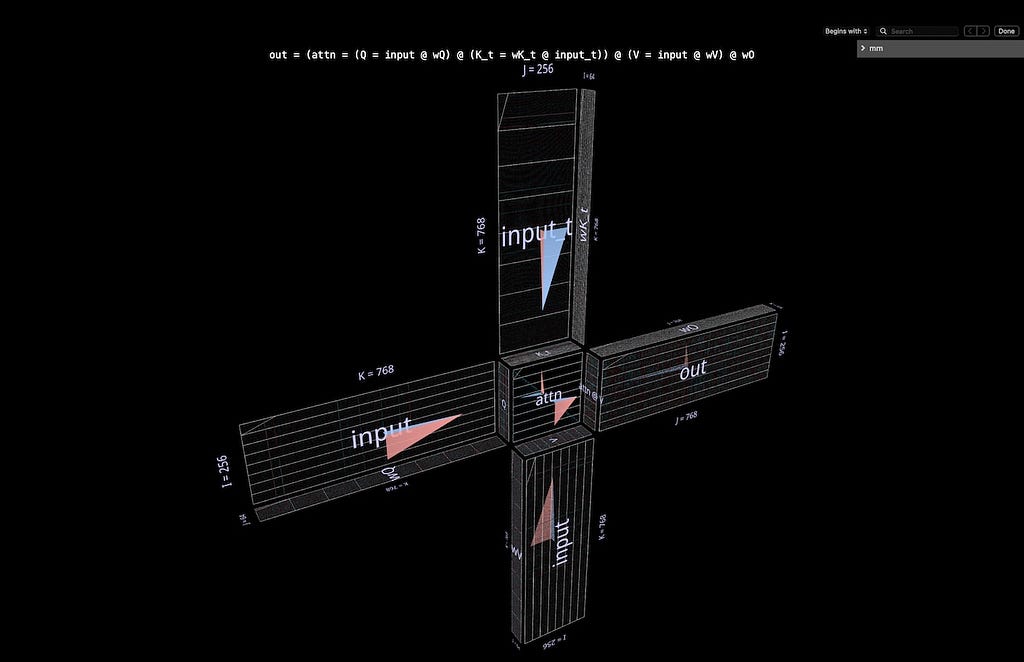
Matrix multiplication is at the core of LLMs, and Basil Hosmer’s mm package makes it easier to see what’s happening under the hood [4]. In his PyTorch blog post, Inside the Matrix: Visualizing Matrix Multiplication, Attention and Beyond, he describes how mm package helps visualize the entire computational process — starting from simple dot products and building up to matrix-vector multiplications, attention heads in nanoGPT, and even large-scale partitioning techniques used in transformer models [5].
What makes this tool so inspiring is how it treats matrix multiplication (matmuls) as a fundamentally three-dimensional operation. Instead of representing matmuls as flat grids, mm folds them into 3D structures, like origami, making it much easier to see how values interact across different dimensions and the relationships between input and output.
Prof. Tom Yeh — Building Transformers in Excel
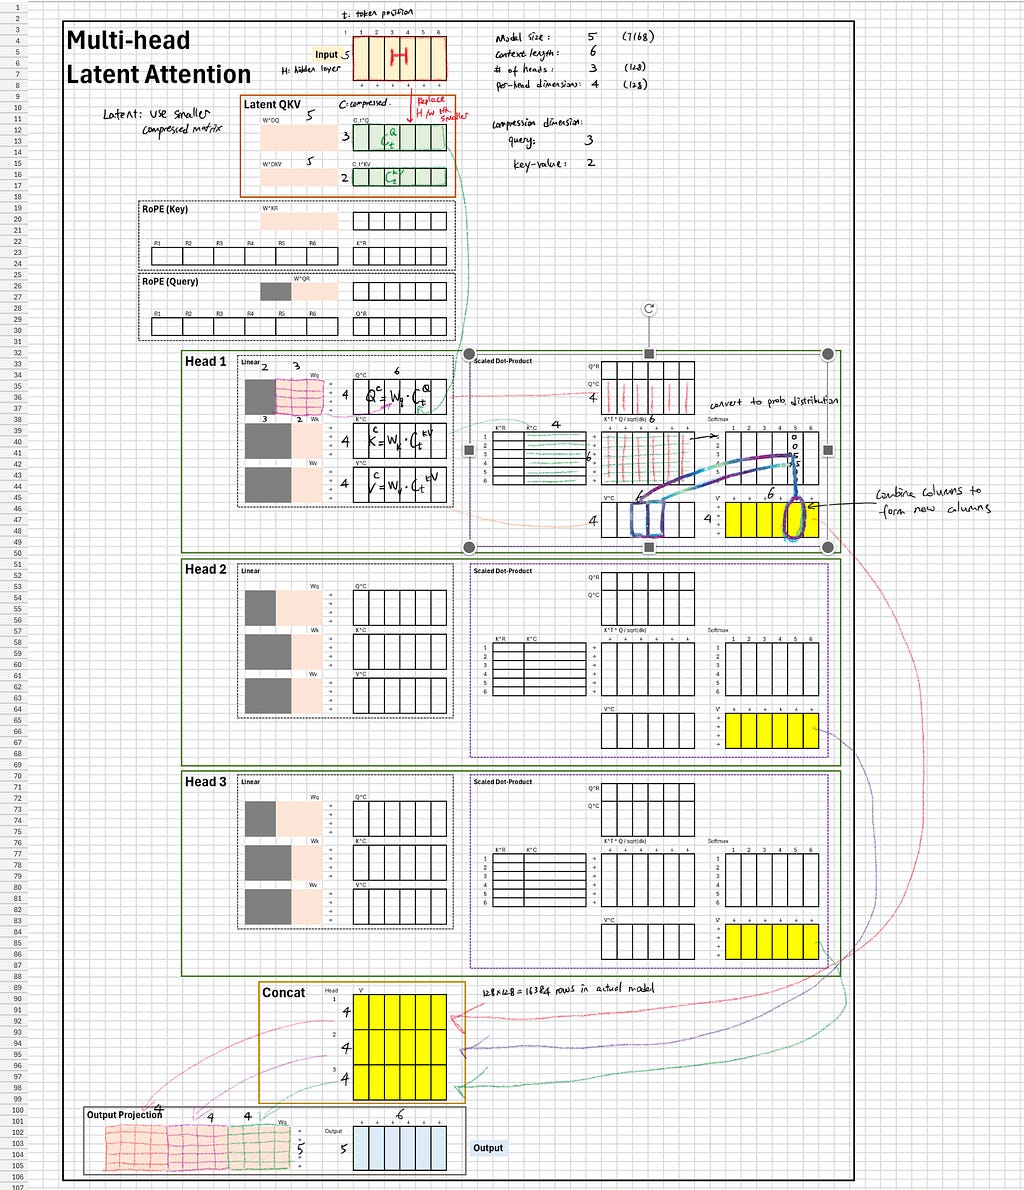
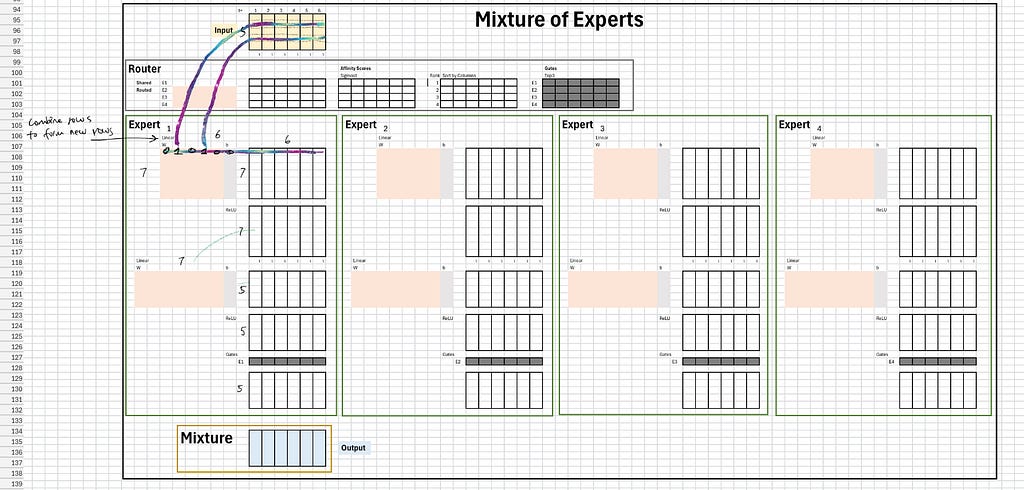
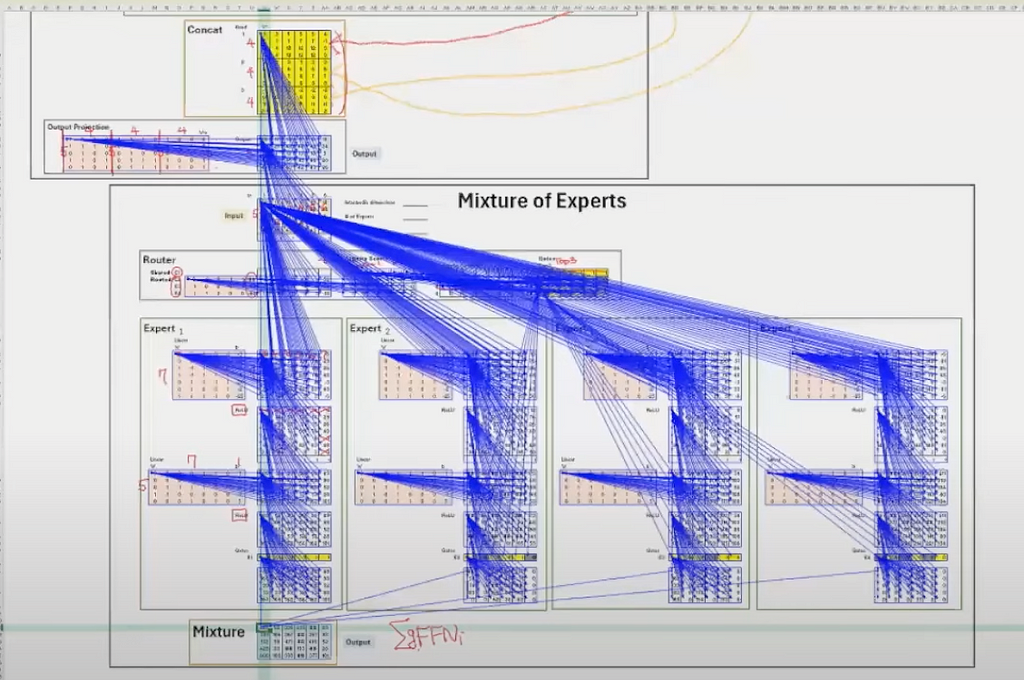
One of the most surprising yet effective ways I’ve come across to build an intuition for LLMs is Prof. Tom Yeh’s Excel-based DeepSeek breakdown [6]. Instead of explaining transformers through code or equations, he manually constructs matrices inside a spreadsheet, walking through dimensions and computations step by step.
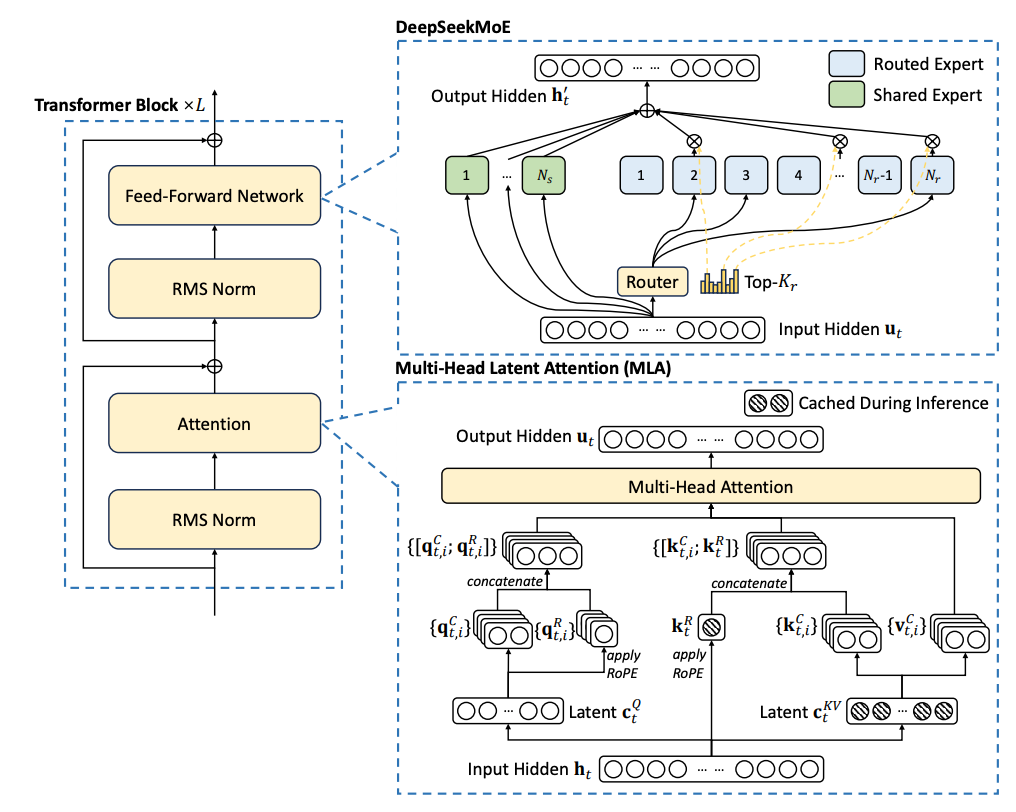
His video explores how DeepSeek’s V2 and V3 models implement:
- Multi-Head Latent Attention (MLA) — Using compressed matrices to optimize computation.
- Mixture of Experts (MoE) — How routers dynamically distribute tokens to different expert layers.
- Computation Flow — Following matrix transformations through attention heads and expert networks.
Seeing transformers modeled in Excel makes everything feel far more tangible. If you like hands-on learning and want a new way to think about attention mechanisms, this approach is well worth a look.
Other Fun Projects Worth Exploring
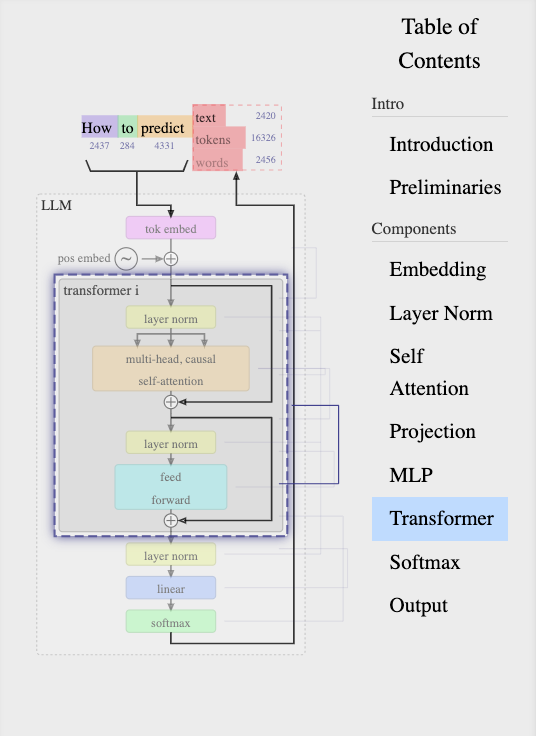
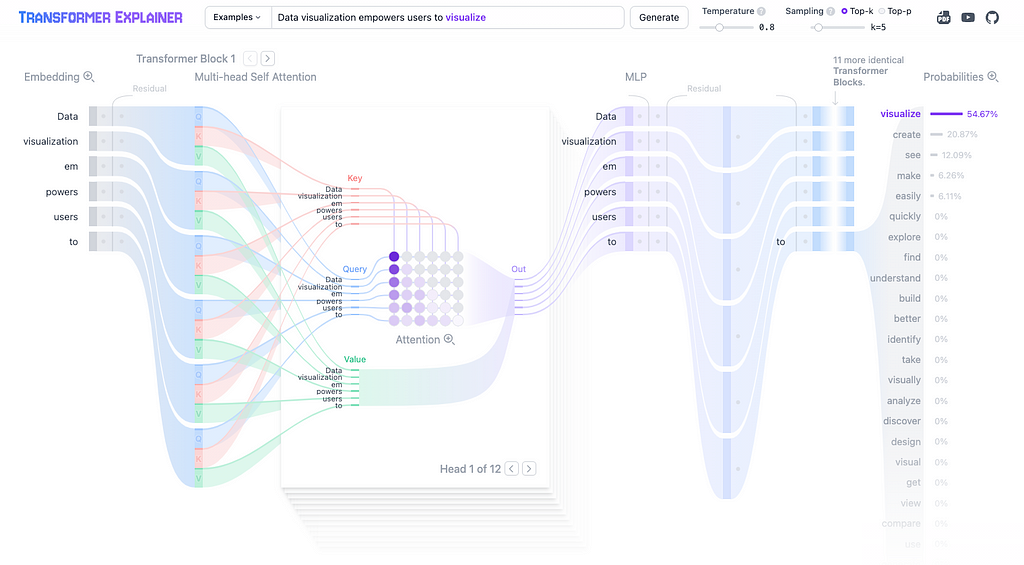
Transformer Explainer
This waterflow-style chart makes it easy to visualize how text tokens move through embeddings, self-attention, query-key-value (QKV) matrices, MLP layers, and the final probability distribution [8].
Machine Learning University (MLU) — Visual explanations of core machine learning concepts
Amazon’s Machine Learning University (MLU) offers great interactive visualizations for breaking down key ML concepts. Whether it’s ROC/AUC, cross-validation, or reinforcement learning, their step-by-step approach makes these ideas easy to grasp [9].
MNIST Digit Recognition Visualization
The MNIST handwritten digit recognition is like the Hello World project of neural networks. This simple interactive tool lets you draw digits and watch activation patterns light up in real-time [10].
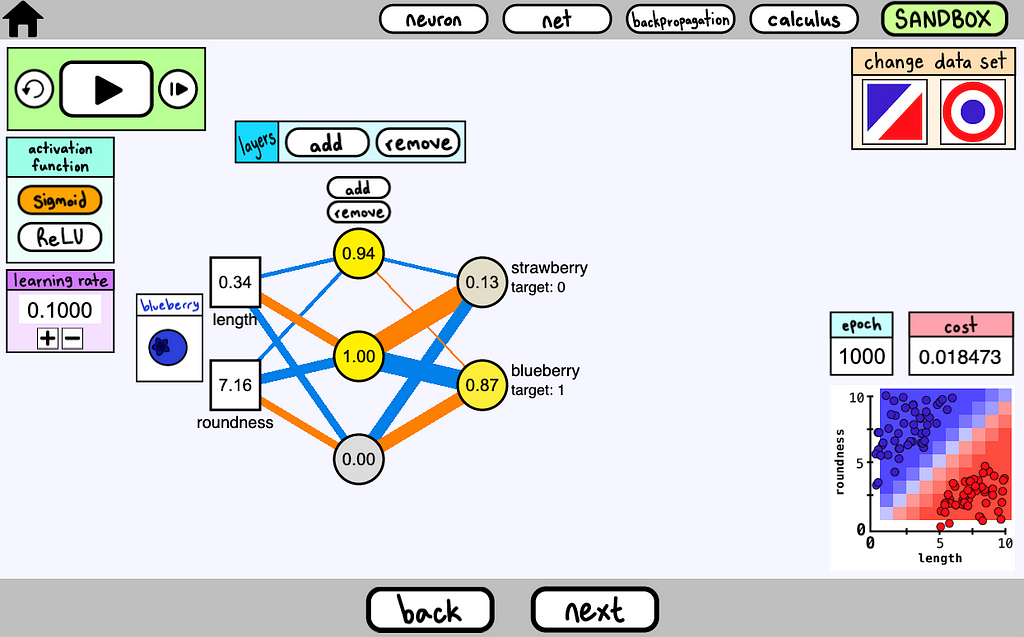
Interactive Cartoon Neural Networks
This is probably the cutest way to introduce neural networks to kids — or anyone new to the concept. With a playful cartoon style, it makes abstract ML ideas like backpropagation, activation functions, and training feel intuitive and fun [11].
Conclusion
Understanding the inner workings of LLMs doesn’t have to be a dry exercise in linear algebra and dense research papers. These visual and interactive resources bring complex concepts to life, making it easier to develop an intuitive grasp of how transformers process information, how attention mechanisms work, and how matrix multiplications form the foundation of it all. Whether it’s a 3D model you can rotate, a spreadsheet-based breakdown, or a playful cartoon explainer, each of these tools offers a unique way to see machine learning in action.
If you know of any other great visualization tools, I’d love to hear about them — there’s always more to explore!
Reference
[1] Grant Sanderson, 3Blue1Brown, Neural Networks Series. https://www.3blue1brown.com/topics/neural-networks
[2] Brendan Bycroft, 3D Visualization of GPT-style LLMs. https://bbycroft.net/llm
[3] Andrej Karpathy, nanoGPT. GitHub*.* https://github.com/karpathy/nanoGPT
[4] Basil Hosmer. PyTorch Blog, Inside the Matrix: Visualizing Matrix Multiplication, Attention and Beyond. https://pytorch.org/blog/inside-the-matrix/
[5] Basil Hosmer, mm — 3D Matmul (Matrix Multiplication) Visualizer. https://bhosmer.github.io/mm/ref.html
[6] Prof. Tom Yeh, AI by Hand, Special: DeepSeek | CSCI 5722: Computer Vision | Spring 25. https://www.youtube.com/watch?v=idF6TiTGYsE
[7] DeepSeek-V2, A Strong, Economical, and Efficient Mixture-of-Experts Language Model. https://arxiv.org/pdf/2405.04434
[8] Polo Club of Data Science, Georgia Tech. Transformer Explained Visually. https://poloclub.github.io/transformer-explainer/
[9] Machine Learning University (MLU). Visual explanations of core machine learning concepts. mlu-explain.github.io
[10] Seonghyeon Kim, MNIST Digit Recognition Visualization. https://okdalto.github.io/VisualizeMNIST_web/
[11] Allison George. Interactive Cartoon Neural Networks. aegeorge42.github.io
Beyond the Math: Visual Resources to Help You Build an Intuitive Understanding of LLMs was originally published in Level Up Coding on Medium, where people are continuing the conversation by highlighting and responding to this story.
This content originally appeared on Level Up Coding - Medium and was authored by Jian Ruan
Jian Ruan | Sciencx (2025-03-12T01:07:36+00:00) Beyond the Math: Visual Resources to Help You Build an Intuitive Understanding of LLMs. Retrieved from https://www.scien.cx/2025/03/12/beyond-the-math-visual-resources-to-help-you-build-an-intuitive-understanding-of-llms/
Please log in to upload a file.
There are no updates yet.
Click the Upload button above to add an update.