
This content originally appeared on Level Up Coding - Medium and was authored by Nikhil Adithyan
Uploading FMP data to Perplexity for strategy insights

A few years ago, performing a fundamental company analysis required significant time and effort. Most importantly, it demanded hundreds of hours of studying, making mistakes (expensive at times), gathering historical data, or making risky assumptions. However, our lives are much easier with the LLMs now available to all of us.
In this article, we’ll explore how to perform stock analysis and generate trading strategies using Perplexity’s reasoning model R1 1776, with data obtained from FinancialModellingPrep, one of the most comprehensive financial data providers.
Preparing the data
1. Historical Market Data
Even though all the LLM models currently have access to historical data, news, etc., it would be more secure for us to download the data that we will provide to Perplexity, allowing us to control the analysis and provide very specific guidance to the model regarding which data it should consider and what answers it should generate using that data.
Let’s prepare the field for some data collection! For our example, we shall use Apple stock.
import pandas as pd
import requests
import json

ticker = 'AAPL'
token = '<YOUR FMP TOKEN>'
Firstly, we will start with the obvious. By using the FMP API for prices, we will obtain the prices from last year until today:
url = f'https://financialmodelingprep.com/api/v3/historical-price-full/{ticker}'

df_ohlc = pd.DataFrame()
querystring = {"apikey":token, "extended":"true", "from":"2024-15-01-01"}
resp = requests.get(url, querystring).json()

df = pd.DataFrame(resp['historical'])[['date', 'close', 'volume']]
df.to_csv(f'{ticker}_prices.csv', index=False)

df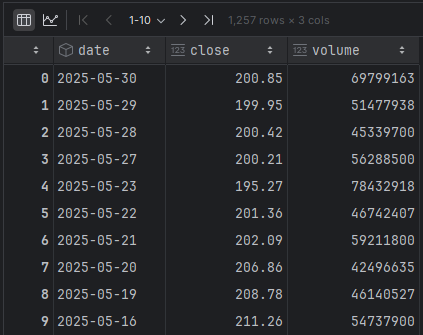
2. Key Metrics
The next step is to obtain the key metrics of the company. When investing in a stock, one of the most important pieces of data for analysis includes metrics like revenue per share, debt-to-equity ratio, and dividend yield, among others. All this and much more is provided by FMP’s Key Metrics API.
You will notice that we retrieve the quarterly figures. The reason is that Apple submitted its annual figures approximately nine months ago, so we wish to have the most recent data. However, if, at the time of your analysis, there are recent annual figures available, it would be preferable to obtain those.
url = f'https://financialmodelingprep.com/api/v3/key-metrics/{ticker}'

querystring = {"apikey":token, "extended":"true", "period":"quarter"}
resp = requests.get(url, querystring).json()
fields_to_remove = ['symbol', 'gradingCompany']
resp = [{k: v for k, v in item.items() if k not in fields_to_remove} for item in resp]

df_grades = pd.DataFrame(resp)
df_grades.to_csv(f'{ticker}_key-metrics.csv', index=False)

df_grades
3. Stock Grade
As we mentioned earlier, we should control the data that Perplexity will analyse, and it will be important to provide what the human (!) analyst is saying about the stock. This will provide information regarding possible downgrades or upgrades to the outlook for the stock. For this reason, we will utilise FMP’s Stock Grade API for grading the stocks. We will obtain the last three months:
url = f'https://financialmodelingprep.com/api/v3/grade/{ticker}'

querystring = {"apikey":token, "extended":"true"}
resp = requests.get(url, querystring).json()
fields_to_remove = ['symbol', 'gradingCompany']
resp = [{k: v for k, v in item.items() if k not in fields_to_remove} for item in resp]
resp = [item for item in resp if item['date'] > '2025-03-01']

df_grades = pd.DataFrame(resp)
df_grades.to_csv(f'{ticker}_grades.csv', index=False)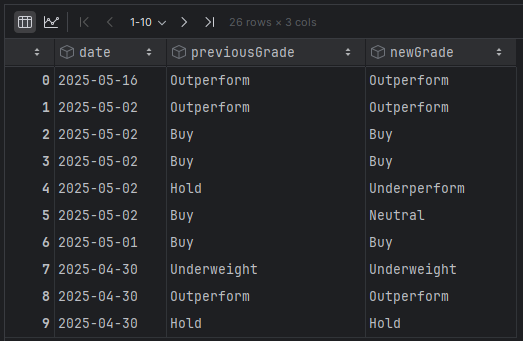
4. News Data
The last thing we will consider is something obvious: the news! Apparently, investors (like you and me) read the news. Despite any ratios or technical analysis, the news is one of the most significant drivers of their decisions. So, let’s use FMP’s Stock News API for that area.
url = 'https://financialmodelingprep.com/api/v3/stock_news'
querystring = {"apikey":token, "extended":"true", "tickers":ticker, "from":"2025-05-01"}
resp = requests.get(url, querystring).json()
fields_to_remove = ['symbol', 'image', 'site', 'url']
resp = [{k: v for k, v in item.items() if k not in fields_to_remove} for item in resp]
df_news = pd.DataFrame(resp)
df_news.to_csv(f'{ticker}_news.csv', index=False)
df_news
Before we move on to the analysis, some notes on the above data:
- We are saving the responses in CSV format so that we can upload them later to Perplexity.
- We are removing data points that we consider are not needed for our analysis. This is important since the less data the model has to process, the faster the response will be. However, we should pay attention not to remove essential ones…
- There are many additional FMP APIs available for downloading relevant information; however, this cannot be demonstrated within the scope of this article. You should explore the suite of APIs to discover what more is offered and make any adjustments you prefer for that process.
Let’s discuss now with Perplexity
Now that we have the necessary data, we should be able to pose specific questions regarding Perplexity. Before that, let us define our target at a high level.
- Understand the current outlook of the stock.
- Given the current outlook of the stock, we should establish our strategy and risk appetite.
- Request the model for a specific strategy.
- Review the strategy proposed.
Now you should go to Perplexity and choose the model you wish to utilise. In our example, we shall select their reasoning model R1 1776.
Upload the four files you saved with the Python code above and prompt the model using the following text:
I am attaching data about Apple stock, which include pricing of the last 5
years, recent news, key metrics, and analysts grading Based on this data,
please provide a high-level outlook of the company, please provide:

- The current trend of the stock (e.g., upward, downward, sideways), supported by recent price movements and patterns.
- The general outlook for the company as indicated by analyst grades uploaded and any consensus sentiment.
- Key takeaways from news uploaded, highlighting any developments that could impact the company's future performance.

Summarize your findings clearly, using bullet points where appropriate.
And let the magic begin. What is interesting is that the model is using Python code itself to retrieve and analyse the data you have attached.
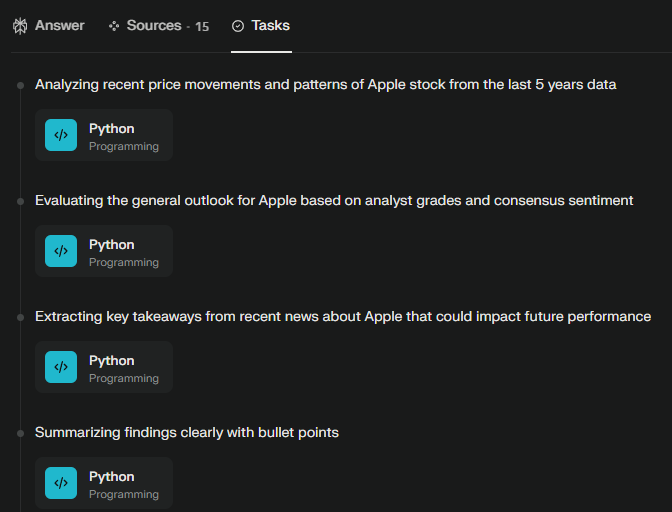
What is also really interesting is the reasoning of the model, which you can see in the tab tasks.

In response to the model, you will find answers to all the points we raised in the prompt. Additionally, as requested, a concise overview will be provided at the end.
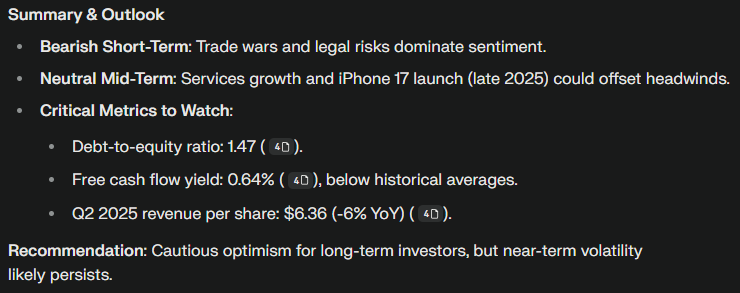
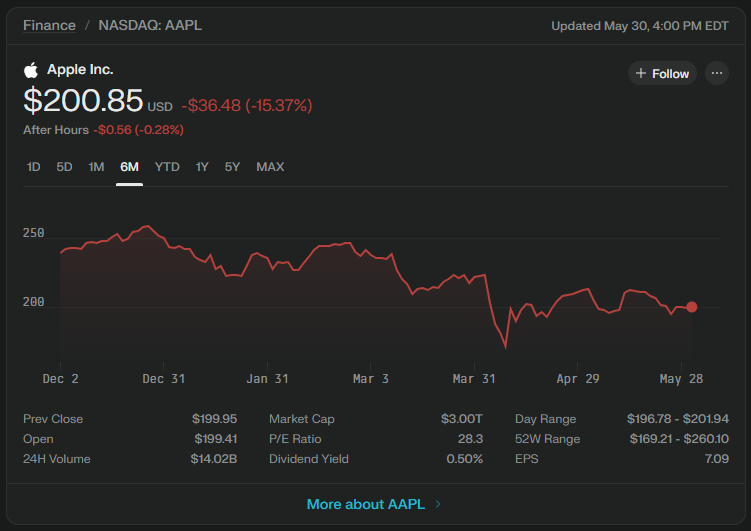
It is interesting that it offers us a bearish short-term outlook due to the uncertainty surrounding the trade wars (!). The mid-term outlook should be neutral, as the new iPhone 17 is expected to launch in late 2025. Ultimately, it recommends that we remain cautiously optimistic.
Also, please note that at the beginning of the response, Perplexity provided a fully interactive chart as shown below.
Let’s get some strategy
Depending on your appetite and the type of investor you are, you can request Perplexity to provide a strategy based on your risk appetite, including the entry points and exits. Instead of doing that, I will continue to discuss various strategies and risk appetites with it, so I can make a decision afterwards.
Based on your analysis with Apple so far, identify possible investment strategies
and their key risk parameters. For each investment type, provide:

1. Entry/Exit Criteria (quantitative thresholds or qualitative conditions)
2. Risk-Reward Matrix (1:3 minimum ratio required)
3. Event-Driven Risk Scenarios (market, operational, regulatory)

||Short-Term (1-6M)|Mid-Term (6-12M)|Long-Term (12M+)|
|---|---|---|---|
|Entry Triggers| | | |
|Exit Conditions| | | |
|Ideal R/R Ratio| | | |
|Top 3 Risk Events| | | |

Required Analysis:
- Specify whether strategies are sequential or concurrent
- Indicate the correlation between timeline risks
- Highlight black swan events with >20% impact probability
- Provide mitigation triggers for each risk tier
- Use probability percentages for risk events
Now, let us see how Perplexity responded.

It clarified that the strategies are concurrent and outlined their correlation based on the recent events:
- trade war risks all timelines
- and product cycles affect mid and long-term
Then it provided us with a strategy matrix:
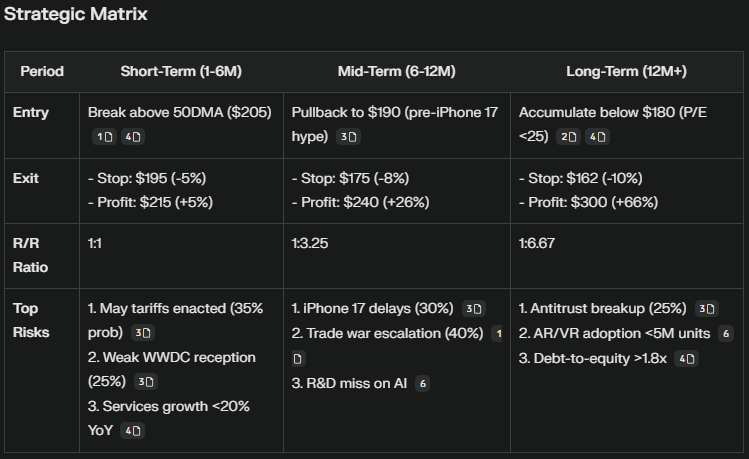

In my view, there are many interesting aspects that illustrate its reasoning, and I believe it provides a clear understanding of each approach:
- You will notice that in the short term, it defines the entry on technical factors (break above 50DMA), for mid-term on a product of the company event (launch of iPhone 17), while for the long term, it is based on fundamentals (P/E less than 25)
- In the short term, it employs a continuation trend approach (break above), while for the mid and long term, it leans more towards a pullback.
- In the long term, it shows some very interesting (and scary) risks, such as antitrust breakup and increased debt.
Following that, Perplexity provides the Event-Driven risk scenarios as below:

It is clear here that the risk-driven events that Perplexity keeps pointing out. What is new in this case are the mitigation actions or triggers:
- It proposes options to hedge risk for the short term
- Proposes an exit if the service margin goes below 65%
Then, Perplexity even provides us with black swan scenarios and their probability:

What is frightening about this answer is the antitrust issues that Apple currently faces and the 10% probability of this occurring, while the consequences will result in a 40% valuation hit.
At the end of its answer, the model provides a probability-weighted outcome:
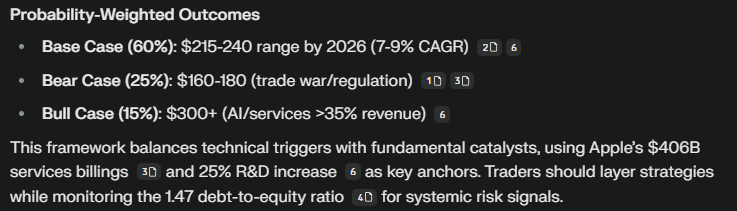
What the model shows us practically is:
- The base case with 60% probability is that by 2026, Apple will be in the range of $215–240, which means a return from current prices of 7% to 20%.
- It provides a significant probability (25%) for the bear case between $160–180, which is between 10% and 20% downwards.
What about Google
To provide another real-world example, I executed the Python code, simply replacing the ticker from “AAPL” to “GOOG”, and uploaded the created file to Perplexity. I used the exact same prompts, apparently changing the word “Apple” to “Google”.
Let’s see from Google’s side, the most important parts of the answers:

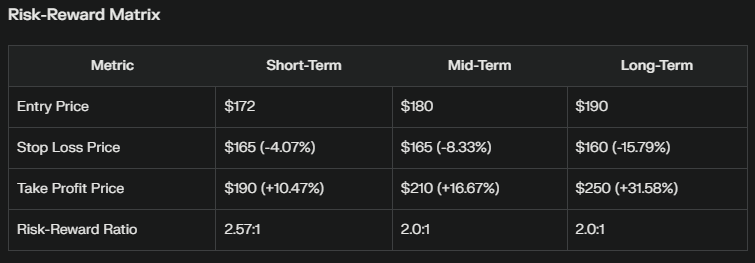
What are the similarities and differences in comparison to the Apple strategies?
- Still, the general idea is technical in the short term, product-oriented in the mid-term, and fundamental in the long term. However, for Google, it becomes much clearer.
- The risk/reward ratios in Apple’s case improved from short to long term (1:1, 1:3.3, and 1:6.7), whereas for Google, the short term is the most appealing option (1:2.57, 1:,2 and 1:2).
For Google, the probability-weighted outcomes are more detailed.

It is interesting that the probabilities for each case are the same for Google as they were for Apple (60%, 25%, and 15%). My research did not reveal any statistical method that would mandate these ratios.
Additionally, while the 60% base scenario makes sense to me, the distinction between the 25% and 15% for bear versus bull requires further clarification. As a result, I asked the perplexity model to explain to me why:

Now that makes sense:
- The crashes are costlier than bull gains
- Recession fears
- Volatile market
We did not need Perplexity to tell us that that ;) However, we can see the reasoning behind something that we might not think about.
Evaluation of methodology with pros and cons
Let’s take a moment to reflect on what we’ve observed so far and consider the pros and cons of using this methodology. To kick things off, let’s talk about the benefits.
Pros:
Complete data processing: AI analyses datasets faster than humans, and what was interesting from the above was the fact that the model pointed out that for Apple, the trade war risks are impacting multiple timelines.
Bias mitigation: Offers an objective analysis of metrics such as P/E ratios and technical indicators, steering clear of emotional decision-making.
Predictive capabilities: Generates probability-weighted scenarios (e.g., 60% base case/$215–240 target for Apple) based on historical patterns.
Multidimensional risk analysis: Identifies layered risks (market, operational, regulatory) and proposes mitigations such as hedging triggers.
Human training: Engaging in discussions with curiosity, you will observe patterns and scenarios that might not cross your mind, at least if you are not a seasoned financial analyst. Interacting with an AI model can effectively train us in the approach we should adopt when reading the news or considering risks we might not even consider.
But what about cons?
Cons:
Data dependency: Requires clean, recent data — while these models have access to various data sources, to ensure their analysis is based on the latest information, we must provide them with our data.
Contextual limitations: Models struggle with qualitative factors such as changes in leadership or nuances in brand perception. In both analyses, we did not observe any mention of these; however, one could argue that these aspects are already reflected in the company’s fundamental risks.
Overconfidence issues: Overconfidence can lead to a misinformed sense of confidence in results when they aren’t validated by a human, such as with uniform probability splits of 60/25/15. It’s important to stay mindful of this risk!
Bias: Although we classified the bias as a pro, there remains a risk that the training data may still include bias that affects recommendations.
Final Thoughts
While AI is fantastic at crunching numbers and spotting patterns, our Apple/Google case studies highlight that it still cannot fully replicate the nuanced judgment of human analysts.
Think of these systems as helpful power tools for data processing rather than oracle machines — it is important to remember that their outputs need contextual validation and ethical oversight.
And as John Mulaney cleverly said:
“The only thing more terrifying than a stupid AI is a smart one that thinks it’s friends with us.”
Generate Trading Strategies using Perplexity with Custom Stock Data was originally published in Level Up Coding on Medium, where people are continuing the conversation by highlighting and responding to this story.
This content originally appeared on Level Up Coding - Medium and was authored by Nikhil Adithyan
Nikhil Adithyan | Sciencx (2025-06-04T15:12:59+00:00) Generate Trading Strategies using Perplexity with Custom Stock Data. Retrieved from https://www.scien.cx/2025/06/04/generate-trading-strategies-using-perplexity-with-custom-stock-data/
Please log in to upload a file.
There are no updates yet.
Click the Upload button above to add an update.