
This content originally appeared on Level Up Coding - Medium and was authored by Asjad Anis
Quick Summary
This article aims to explain how to write efficient and performant React components along with some common profiling techniques at our disposal which we can use to figure out unoptimized rendering behaviors in our app and improve the performance.
Audience
The targeted audience for this article is mid-to-senior level React engineers who are well familiar with the library and have a good understanding of how the library works, especially the Virtual DOM, reconciliation, and how the library renders and updates the actual DOM.
React is a great library that allows you to write applications declaratively. This approach is great because it abstracts away all the functional and internal details on how the library achieves a specific UI state and ensures to keep the DOM in sync with the state you describe. This is achieved by keeping a Virtual DOM and the process of reconciliation. Let’s look at these two terms in order to understand them properly
Virtual DOM and Reconciliation
The Virtual DOM as the word itself suggests is basically a virtual representation of the UI, you can think of it as a blueprint that contains all the necessary details required to construct an actual DOM. React relies on the Virtual DOM to efficiently render only the components that have been updated. Any interaction with the application that is associated with some state will likely cause the application to trigger a re-render, but React does this part efficiently by only updating the Virtual DOM first instead of the actual DOM and then applying a comparison algorithm on the new and old Virtual DOM’s to detect if an actual DOM update is required.
This diffing algorithm is basically what enables React to determine what DOM elements or attributes to update and makes it efficient.
You can read more about the diffing algorithm on the official React docs.
One of the main reasons for performance issues in a React app is some faulty implementation on our end or unnecessary re-rendering especially when its resource-intensive and doing some expensive calculations that causes repeated triggering of this diffing and rendering cycle and triggering updates to the actual DOM which can result in a performance hit and a slow experience.
In order to achieve good performance on our application, we need to ensure that React is only updating the components that are affected by the state change and ideally ignore all other components, this will result in saving up the wasted CPU cycles and resources that went in for re-rendering the unaffected components and give us a performance boost in our application.
Optimizing a React application without profiling or benchmarking won’t do us much good as there is a cost associated with the optimization techniques and if not done correctly the performance gains might not be worth the complexity introduced in the codebase and could potentially affect the performance
Let’s get started with a very simple application that I have created and profile it along the way to see if the optimizations are doing us any good
// Clone the repo and switch to profiling branch
git clone https://github.com/asjadanis/react-performance-tutorial
git checkout profiling
Install node modules by running yarn and then start the application by running yarn start you should see something like below in your browser.
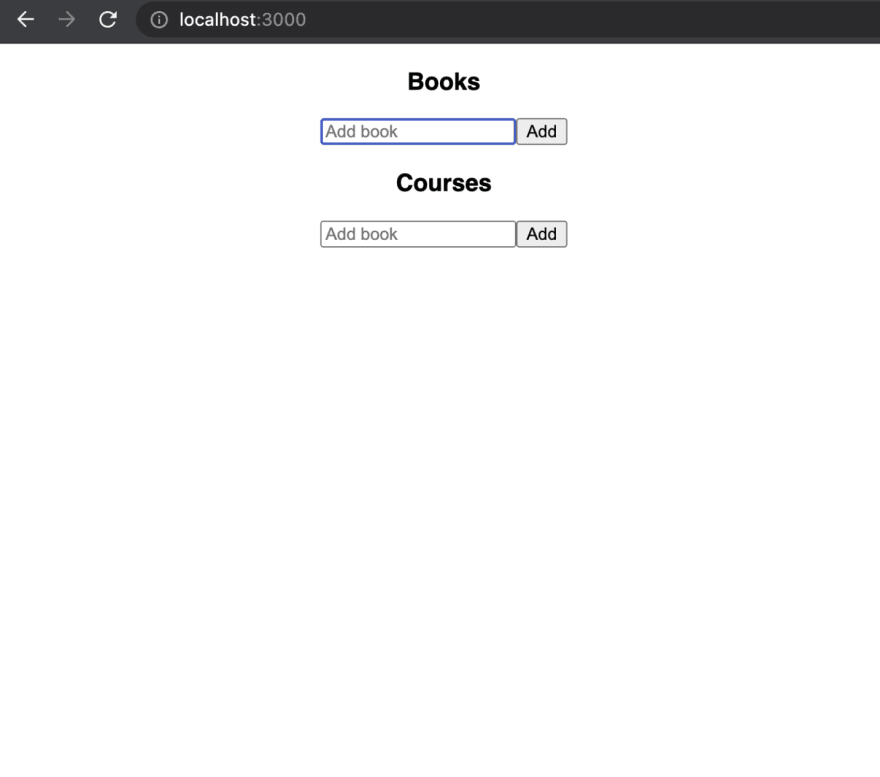
Now open up the browser console and play with the application add some books, courses and if you see some odd rendering behavior great, if you can’t figure it out I’ll break it down for you when you add a book you will notice that the courses list gets rendered too and vice versa. This is sub-optimal and not the desired behavior and we will be optimizing our components to ensure that only those components get rendered that are affected by the state change. Before we dive into profiling let us quickly go through the code so we know what we are dealing with.
Our app is composed of three components first up is App.js that is our main component it contains the logic for adding books and courses and it passes down the handlers and books/courses states as props to the List component.
The List component provides input control to add books or courses using the AddItem component and maps over the list of books and courses to render them.
That’s pretty straightforward, every time we add a book or a course we are updating the state in our App.js component causing it to render and its children. So far so good now we can jump straight into our IDE and fix this behavior but in this article, we are going to take a step back and first profile our application to see what's happening.
I pre-configured the repo with a nice package why-did-you-render which basically enables you to see any avoidable re-renders in your application during the development mode.
You can check out the package docs to see how you can configure it with your setup.
Note: Don’t use this package in your production build, this should only be used in the development mode and should be in your devDependencies.
Profiling
First of all, you need to set up the React Developer Tools which is available as a browser extension and allows us to profile our React applications. You’ll need to set it up for your browser in order to follow along with the profiling section, once you have it set up head over to the application on http://localhost:3000/ and open developer tools.
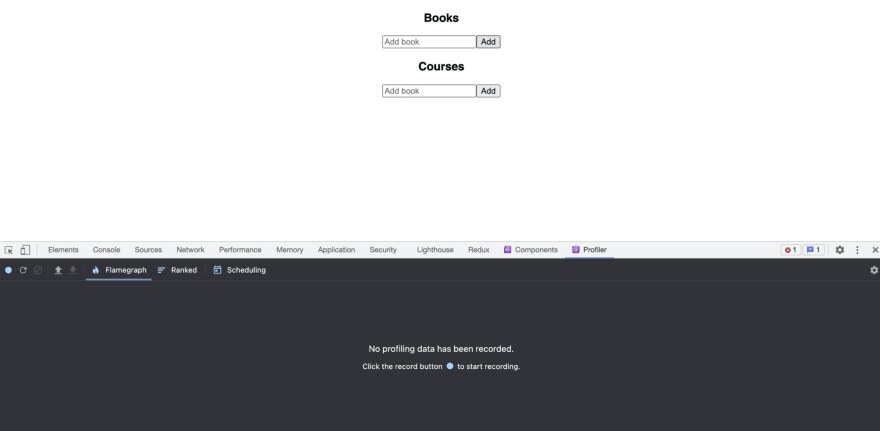
Now head over to the profiler tab and you should be able to see something like the below screenshot in your dev-tools
In order to profile our application for performance hits and see how rendering is happening we need to record our application while using it, let’s do that. Hit the record button and then interact with the application add some books and courses and then stop recording. You should be able to see a flame graph of your app components and how long each component took to render out of the total render duration. The greyed-out components indicate that they did not render during that commit.
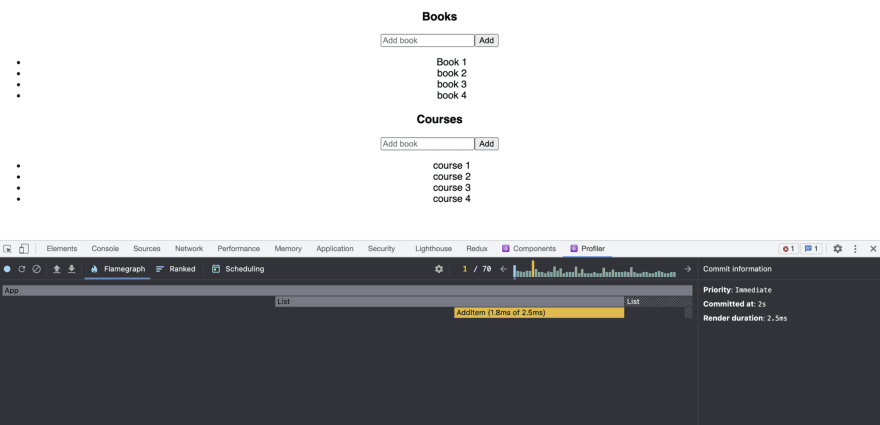
From here onwards you can step through the various commits in the graph and take notes of which components are taking the most time to render and if there are any wasted renders. The bars peak is a quick visual indicator for which commit took the most time to render and then you can click on it to further see each of the components that caused it. In our case, we can see a yellow peak followed by a couple of green peaks which indicate the rendering happening when we add a book or course.
Here we can see that our App component is rendering which makes sense as we are updating the state. Rendering both lists is although unoptimized as we can only update one list at a given time and we only want the respective list to render but in our case, both lists are re-rendering along with the AddItem component they compose of. Now that we have a clear picture of what’s happening let’s fix this behavior by wrapping our List component in React.memo which is a higher-order component that enables React to skip rendering for a specific component given the new props are the same as old props. Note that React.memo only compares props so if your wrapped component includes internal state, updating that will still cause the component to re-render which is desired.
Optimizing the Components
In order to fix this behavior head over to the List component and import memo from React and wrap the default export with memo
// List.js
import { memo } from "react";
const List = (props) => {
 ...
 ...
}
export default memo(List);
Looks good now let’s give it a try keep your browser console open and add a book to the list you should notice that even after wrapping our component in React.memo both our lists are still rendering sound strange right? You should also notice some additional console logs telling us why the List component re-rendered as below
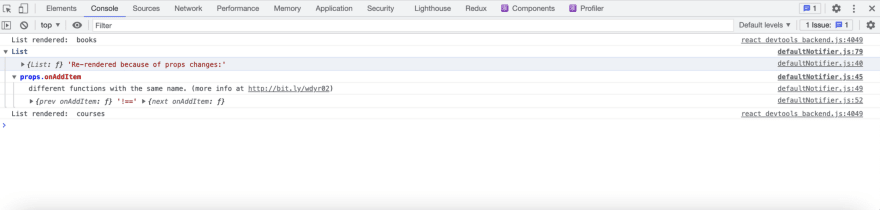
These console logs are coming from the why-did-you-render package that we talked about earlier which enables us to see any avoidable re-renders in our React app. Here it’s telling us that the component re-rendered because of props changes and specifically the onAddItem function. This is happening because of the referential equality in JavaScript, every time our App component renders it will create new functions for our handlers and the referential equality will fail as both functions won't be pointing to the same address in memory this is just how JavaScript works. You should read more about referential equality in JavaScript in order to get a good grasp of this concept.
To fix this behavior in React what we can do is wrap our handlers in a useCallback hook which basically returns a memoized version of our handlers and it will change only if one of the provided dependencies changes. This will ensure that the new instance of our functions are not created and will prevent the re-rendering. Note here that memoization is not something specific to React but a general optimization technique used in programming to store results of expensive computations and return cached results when already computed.
Let’s wrap our handlers in a useCallback
import { useCallback } from "react";const onAddBook = useCallback((item) => {
setBooks((books) => [...books, { item, id: `book-${books.length + 1}` }]);
}, []);const onAddCourse = useCallback((item) => {
setCourses((courses) => [
...courses,
{ item, id: `course-${courses.length + 1}` },
]);
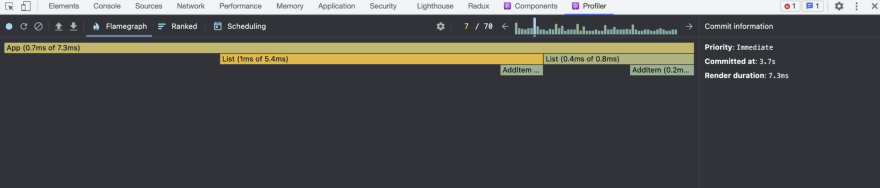
}, []);We are passing an empty dependency list as we don’t want our handlers to be re-initialized on every render but if required you can add the dependencies there, Let’s run the application now and see how it behaves, if you add any book or a course now you will immediately notice that only the respective list gets re-rendered which is great but let’s also profile it to see if we have gained any significant performance boost although our sample application is very simple and straight forward but if it were to be a bit complex consider each list item had a children array on it which can be further listed down and included some logic that was resource intensive and so on you can imagine in such a scenario the re-rendering would definitely be a problem. Below are the results after profiling you can give it a try yourself too.
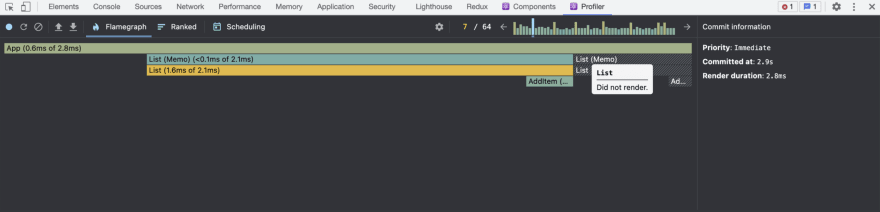
We can see above that after memoization the total render duration for the highest peak in our flame-graph took about 2.8ms compared to 7.3ms before and our second List component did not render, this sounds great we have successfully saved around 4.5ms wasted in rendering time by putting in about 15-20 mins debugging, profiling, optimizing and the performance benefits in our case don't make any visual difference as the app is quite simple and doesn't take a lot of resources in re-rendering, but this doesn't mean we did this all for nothing the purpose was to understand the behavior and reasoning behind re-rendering and objectively approaching at optimizing the application instead of randomly wrapping everything in React.memo and React.useCallback. Now we have developed a basic mental model that we can use when approaching performance-related issues in a React app.
Another thing to keep in mind here is that React is smart enough to determine which DOM nodes to actually update, in our example above even though our List component is unnecessarily re-rendering React isn’t triggering actual DOM updates unless necessary you can verify this is in your browser dev-tools and since React is taking care of the more expensive part i.e DOM updates in our simple example above we probably don't even need to optimize our components. Such optimizations are more fruitful when our components are expensive to render or include some expensive calculations during the rendering phase that is just wasting CPU cycles and is not required.
General Guidelines
Keep the below points in mind when using React.memo
- React.memo does a shallow comparison of props by default
- You can pass in a custom function as a second argument to React.memo adding your custom logic to compare props.
- If you need to do a deep comparison of props then keep in mind that it comes with additional cost depending on the complexity of your props.
- It makes sense to use React.memo when your component renders the same thing when it's given the same props or if it's computationally expensive to render unlike our list component above.
If you are working with React class components you can use shouldComponentUpdate life-cycle method or React.PureComponent to achieve the same behavior but make sure you aid it with profiling.
You can use the useMemo hook to memoize any computationally expensive calculations on every render, make sure to provide a dependency array in case the memoized value is dependent on some other fields and needs to be recalculated if any of those fields is changed.
Conclusion
The objective of this blog was to build a mental model when approaching optimization problems in React applications and emphasize on profiling techniques to objectively achieve it. Optimization techniques come with a cost if not used properly and wrapping everything in memo or useCallback won't magically make your apps fast, but using them properly and profiling along the way could definitely be a lifesaver.
As always feel free to share your thoughts with me in the comment section or connect with me on Twitter.
Optimizing React App Performance was originally published in Level Up Coding on Medium, where people are continuing the conversation by highlighting and responding to this story.
This content originally appeared on Level Up Coding - Medium and was authored by Asjad Anis
Asjad Anis | Sciencx (2021-09-28T12:33:18+00:00) Optimizing React App Performance. Retrieved from https://www.scien.cx/2021/09/28/optimizing-react-app-performance/
Please log in to upload a file.
There are no updates yet.
Click the Upload button above to add an update.