
This content originally appeared on DEV Community and was authored by Tarek N. Elsamni
The Horizontal Pod Autoscaler automatically scales the number of Pods in a replication controller, deployment, replica set or stateful set based on observed CPU utilization (or, with custom metrics support, on some other application-provided metrics). Note that Horizontal Pod Autoscaling does not apply to objects that can't be scaled, for example, DaemonSets.
How does the Horizontal Pod Autoscaler work?
The Horizontal Pod Autoscaler is implemented as a Kubernetes API resource and a controller. The resource determines the behavior of the controller. The controller periodically adjusts the number of replicas in a replication controller or deployment to match the observed average CPU utilization to the target specified by user.

To learn more about how Kubernetes HPA works you can read this detailed article from the official kubernetes.io.
The most common example of the HPA configurations are based on CPU/Memory utilisation metrics provided by metrics-server. In this article I'll give an example of scaling up/down a Kubernetes deployment based on application-specific custom metrics. The application will be a Node.js (Express) server with WebSockets support and the goal will be to scale up/down the deployment based on number of connected clients (connections count).
To achieve this goal, this post will focus on:
- Creating a demo app with WebSocket support.
- Integrating prometheus-client to expose WebSocket stats as a prometheus metric.
- Configuring Prometheus to harvest the exposed metrics.
- Setting up prometheus-adapter to convert the prometheus metric to HPA complaint metric.
- Configuring HPA to utilise and consume the complaint metric.
Creating a demo app with WebSocket support
The following code will create a demo Express app and integrate WebSocket on /ws/ path.

https://github.com/shebang-labs/websocket-prometheus-hpa-example/blob/main/app.js
Integrating prometheus-client to expose WebSocket stats as a prometheus metric
The following code will integrate a prometheus client and expose a prometheus standard/complaint websockets_connections_total metric on port 9095. Next step is to guide prometheus to start harvesting and collecting this metric and persist the stats over time.

https://github.com/shebang-labs/websocket-prometheus-hpa-example/blob/main/app.js
Configuring Prometheus to harvest the exposed metrics
In this stage, I will use Helm to deploy prometheus on the kubernetes cluster. First, we need to add the helm repo for prometheus using this command:
helm repo add prometheus-community https://prometheus-community.github.io/helm-charts
Then we can install prometheus with a persistent volume to store and persist the metrics data over time with the following command:
helm upgrade --install prometheus prometheus-community/prometheus --namespace prometheus --set alertmanager.persistentVolume.storageClass="gp2",server.persistentVolume.storageClass="gp2"
At this point we should have the prometheus components up and running perfectly on the kubernetes clsuter on the prometheus namespace as shown in the following:

Prometheus Namespace (Kubernetes)
To guide prometheus to start scraping/collecting the application exposed metric websockets_connections_total over time, we need to annotate the pod which runs the Express app with the following annotations:
prometheus.io/scrape: 'true'
prometheus.io/port: '9095'
So the application deployment would look something like:
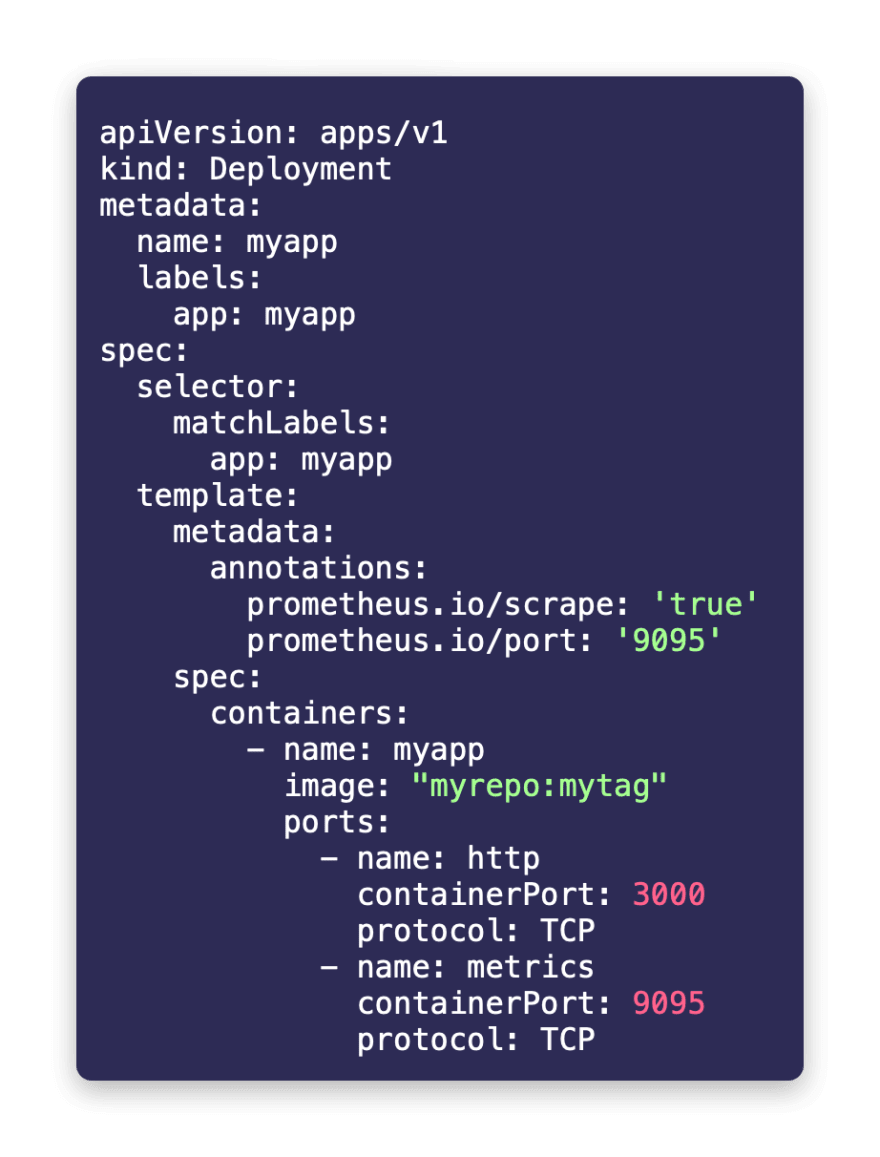
https://github.com/shebang-labs/websocket-prometheus-hpa-example/blob/main/deployment.yaml
Setting up prometheus-adapter to convert the prometheus metric to HPA complaint metric
At this stage Prometheus is scraping the metrics every 1 second from port 9095 from all pods in this deployment. To verify this, you can port-forward the prometheus server to localhost and access its query/dashboard UI using the following command:
kubectl --namespace=prometheus port-forward deploy/prometheus-server 9090
which will make the dashboard accessible on localhost:9090. Then you can search for websockets_connections_total to see the scraped metrics over time as shown here:

In this example the query returned 2 graphs as there are 2 pods in this deployment generating different websockets_connections_total values. One of the pods has 1-2 websocket connections overtime and the other has 0 connections.
In the next step we will start using averages (sum of reported connections counts from different pods / pods count) to decide on how scale up and down. But first we need to transform this Prometheus metrics into HPA complaint metric. We can achieve this using prometheus-adapter.
You can install prometheus-adapter as a helm chart. You need to point the adapter to the prometheus instance to query the data from there. Also you will need to tell the adapter how to query the metrics, transform and format it.
This can be done using the following custom helm configurations:
prometheus:
  url: http://prometheus-server.prometheus.svc
  port: 80

rules:
  custom:
    - seriesQuery: '{__name__=~"^myapp_websockets_connections_total$"}'
      resources:
        overrides:
          kubernetes_namespace:
            resource: namespace
          kubernetes_pod_name:
            resource: pod
      name:
        matches: "^(.*)_total"
        as: "${1}_avg"
      metricsQuery: (avg(<<.Series>>{<<.LabelMatchers>>}) by (<<.GroupBy>>))
prometheus-adapter-values.yaml
Now, you can use this file to install a custom prometheus-adapter as follows:
helm upgrade --install prometheus-adapter prometheus-community/prometheus-adapter --values=./prometheus-adapter-values.yaml --namespace prometheus
To verify that the adapter did work as expected, you should be able to query the HPA custom metrics using the following command:
# I'm using jq for better formatting. You can omit it if needed.
kubectl get --raw "/apis/custom.metrics.k8s.io/v1beta1/namespaces/myapp-namespace/pods/*/myapp_websockets_connections_avg" | jq .
This should show a result like:

Configuring HPA to utilise and consume the complaint metric
Using the following HPA definition we can control the deployment scaling up and down configs based on the avg websockets connections per pod:
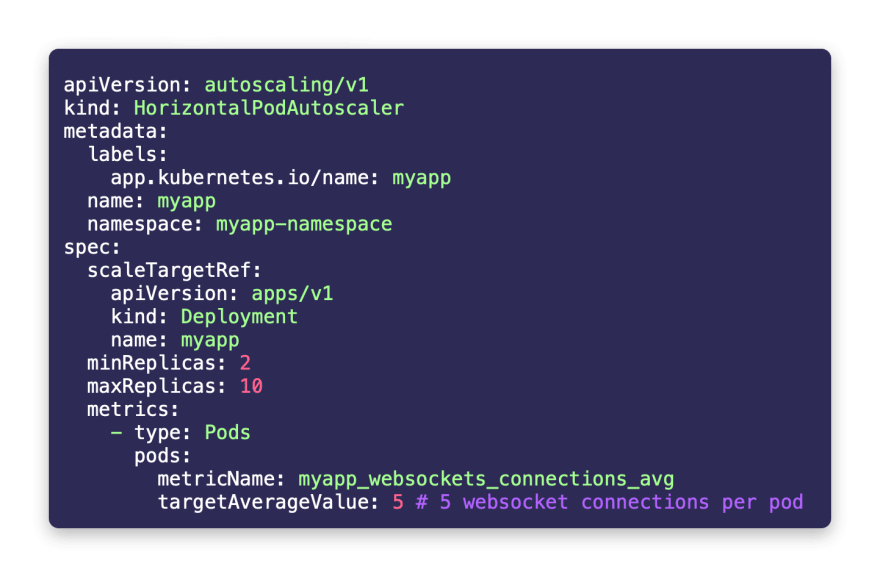
https://github.com/shebang-labs/websocket-prometheus-hpa-example/blob/main/hpa.yaml
In this example, I've configured the min replicas to be 2 and the max to be 10 and then Kubernetes will use the myapp_websockets_connections_avg value over time to align with the target 5 connections per pod and it will scale up and down dynamically to match this target ??
This content originally appeared on DEV Community and was authored by Tarek N. Elsamni
Tarek N. Elsamni | Sciencx (2021-02-09T00:04:09+00:00) Horizontal scaling WebSockets on Kubernetes and Node.js. Retrieved from https://www.scien.cx/2021/02/09/horizontal-scaling-websockets-on-kubernetes-and-node-js/
Please log in to upload a file.
There are no updates yet.
Click the Upload button above to add an update.