
This content originally appeared on Bits and Pieces - Medium and was authored by Charuka Herath
Get to know the tool stack for WebAssembly debugging
WebAssembly is referred to as the modern binary format for the web. It is an open standard to develop applications running in the browser, allowing more than 40 programming languages, including C and C++, Python, Go, Java, Rust, and PHP.
“Most importantly, these programs can run near-native speeds in the browser.”
Debugging WebAssembly
Until recently, Chrome DevTools had limited support for WebAssemby debugging. We could only analyze individual instructions in a disassembled WebAssembly text formats and viewing raw stack traces.
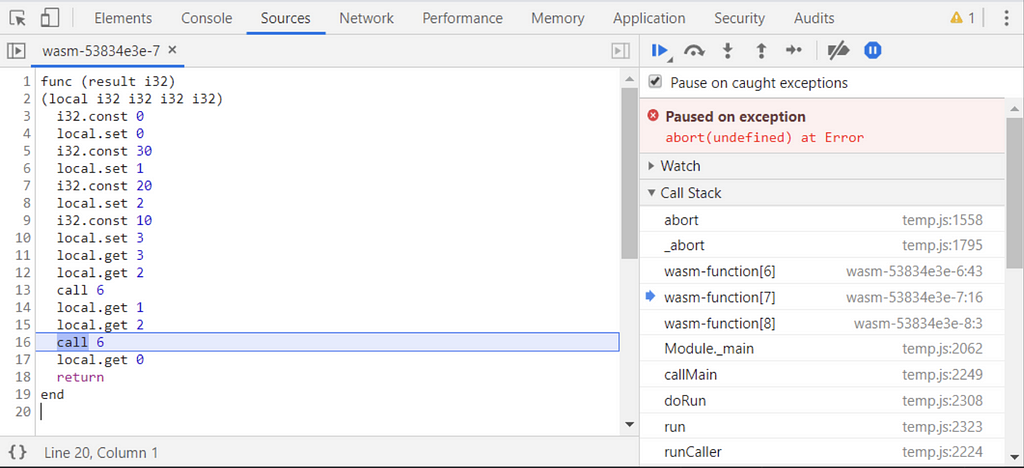
This approach works fine with WebAssembly modules, which have isolated functions that have a small debugging scope. However, it was not suitable for complex applications where the mapping between the source code and the disassembled WebAssembly code was not that obvious.
As a solution, Emscripten and DevTools have temporarily adopted the existing source maps format to WebAssembly.
A source map is a way of mapping a combined/minified file back to an unbuilt state. When using source maps, client-side code will be readable and, more importantly, debuggable, even without impacting performance.
This allowed mappings between binary offsets in the compiled module to original locations in source files.
Emscripten
Emscripten is a compiler toolchain to WebAssembly, with a special focus on speed, size, and the Web platform.
One of the main advantages of debugging cross-platform Emscripten code is that we can debug the code using either the native platform or the Chrome DevTool debugger and profiler.
Functionalities
- Emits debug logs using Debug mode and stores intermediate build files for analysis.
- Enable runtime checking of memory accesses and common allocation errors.
- Auto Debugger can instrument low-level virtual machine code.
However, source maps were designed targeting textual programming languages like JavaScript, where binary formats like WebAssembly find their limits.
Emscripten also adopted source maps, which leads to less integration-friendly, hacky, and less supportive outside Emscripten.
DWARF
DWARF is a debugging file format used by many compilers — Source
There is a Devtool Plugin supporting DWARF which you can install using the Google Chrome Webstore.
It supports debugging C/C++ WebAssembly applications using DWARF debug information. This extension serves as an adapter between a WebAssembly app running in the browser and Chrome DevTools. It enables developers to debug C++ applications that are exported to WebAssembly in Chrome DevTools 88+ directly.
Furthermore, DWARF provides necessary data for debuggers to resolve type layouts, variable names, locations, and many more.
Recently Chrome DevTools also added a feature supporting native source mapping using DWARF information.
New Features added for DWARF in Chrome DevTools.
- Compilers like Rust and Clang already support emitting DWARF information in WebAssembly modules. This leads the Google dev team to use DWARF directly in their DevTools.
- Also, support of the native source mapping is available in DevTools, so developers can debug Wasm modules produced by any Rust or Clang based compilers without using any custom scripts.
- Developers can observe the code when debugging, resolve stack traces, and set breakpoints un source code by using new DevTools integration with DWARF.
However, there are still some WebAssembly-specific features that need to be added for full compatibility.
A Practical Use Case
Let us take Google Earth as an example application to debug, which depends on WebAssembly.
Debugging without using DWARF
First of all, you need to visit the google earth website and go to the sources to inspect in Chrome DevTools. After that, you can see the generated JavaScript and WebAssembly files.
Then, set a breakpoint at any entry point. When you do that and reload the web page, it will stop at the breakpoint, and from there, you can step into the Emscripten generic JavaScript.
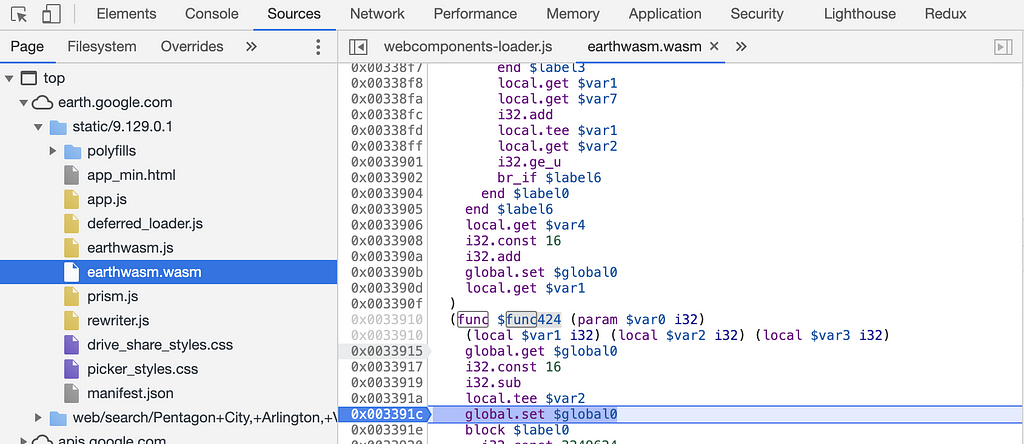
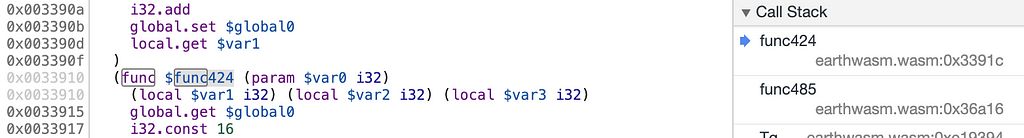
We can see that DevTools has generated a function name for us ($func424), which is also showing at the Call Stack. The function name is based on the expert name. Even when you do not have any debugging information attached, you still get readable stack traces with the necessary debugging tools.
If you can observe the Scope view of the debugging environment, you can see some variables that should be coordinated with the location we search on Google earth. However, it is readable, and developers have to guess the Scope’s real values.
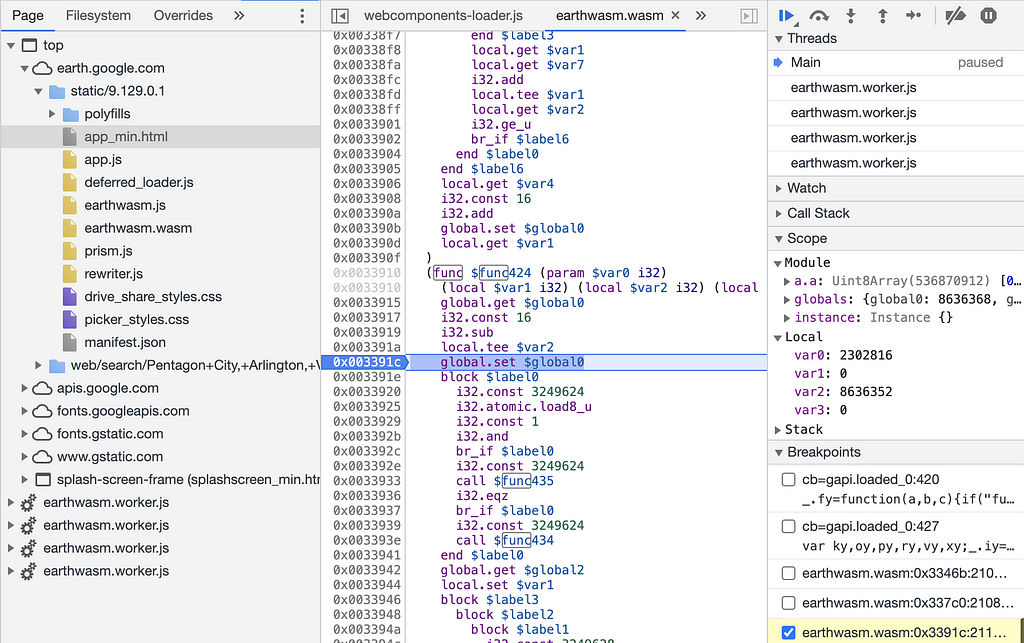
However, the primary debugging environment is not a great one. It takes quite a bit of guesswork to understand what all these instructions mean and what all these variables are and how it matches our original code.
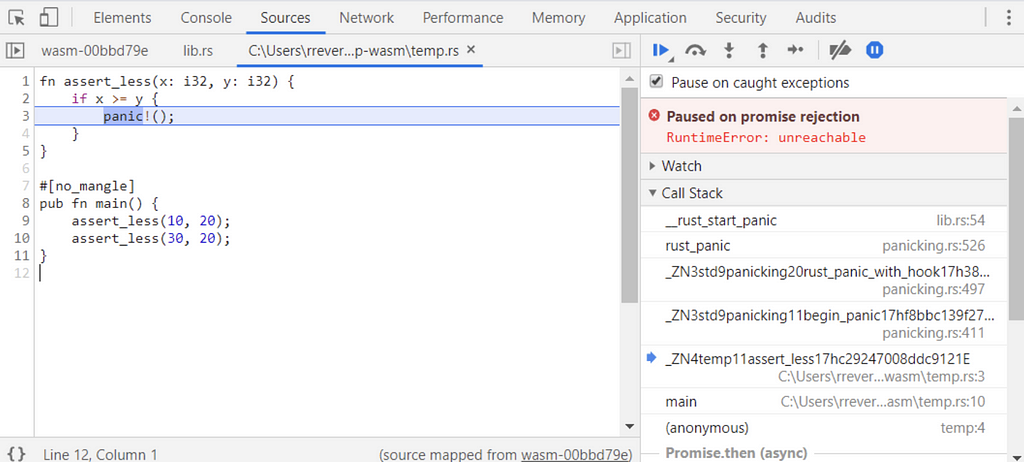
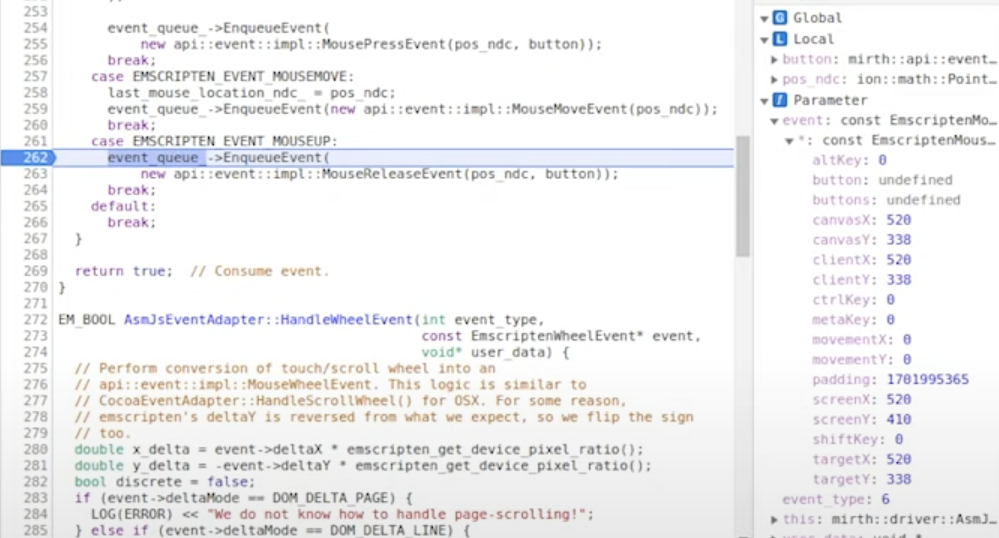
Debugging with DWARF
Google Earth is successfully using the new debugging experience combined with this option to debug WebAssembly builds of their extensive C++ application on the web.
You can see how they can all set breakpoints in the click handler’s source, and they can trigger them from the web page, steps for the C++ expressions, and some of the variables.
All in all, this has some remarkable improvements that will unlock new possibilities to improve web applications’ user experience.
Advantages of using WebAssembly for debugging
- Since WebAssembely supports source maps, developers can view source code in the developer tools option.
- Google Earth is accessible and can debug on Firefox, Edge, and Opera browsers.
Drawbacks of using WebAssembly for debugging
- Still, the Google team is working to make it accessible by Safari because Safari lacks full support for WebGL2.
- WebAssembly does not fully support dynamic memory allocation.
Future works for WebAssembly tools
Still, it is not the end of the journey for the Google Dev team. There are more features to be at work here.
- Raw memory inspector for raw memory view.
- Custom fomatters for C++ types.
- They are working on improved profiling code coverage support.
- For now, wasm-pack(wasm-bindgen) does not support updating DWARF information on transformations. So, the Dev team will focus on that as well.
- The Dev team will be working on resolving variable names on the DevTool side.
- Evaluate expressions in source languages.
However, there is a lot to be improved in DWARF. Hopefully, we will be able to use it more powerfully by considering the dev team’s future approach.
Thank you for reading. Feel free to leave a comment down below and share your experience as well with WebAssembly.
Tip: Share your components between projects using Bit.
Bit makes it simple to share, document, and reuse independent components between projects.
With Bit, every component can be independently maintained and developed so that you don’t need to worry about structuring a full dev environment just to make a few changes.
Use Bit to collaborate more effectively and keep a consistent design.
Bit (Github) supports Node, TypeScript, React, Vue, Angular, and more.
Read More
- A Complete Introduction to WebAssembly and Its JavaScript API
- What’s Wrong with Web Assembly?
- TypeScript to WebAssembly: The What, The How And The Why
Debugging WebAssembly with Chrome DevTools was originally published in Bits and Pieces on Medium, where people are continuing the conversation by highlighting and responding to this story.
This content originally appeared on Bits and Pieces - Medium and was authored by Charuka Herath
Charuka Herath | Sciencx (2021-02-11T22:11:18+00:00) Debugging WebAssembly with Chrome DevTools. Retrieved from https://www.scien.cx/2021/02/11/debugging-webassembly-with-chrome-devtools/
Please log in to upload a file.
There are no updates yet.
Click the Upload button above to add an update.