
This content originally appeared on DEV Community and was authored by brandon_wallace
Did you know that you can easily have a Bash script display information on the Tmux status bar? Because of that the possibilities are almost endless. You can display all sorts of valuable information such as:
- Hostname
- IP address
- Netmask
- Gateway
- Memory usage
- Memory total
- CPU temperature
- System load
- Battery meter
- VPN status
- Time
- Date
- Weather report
- Git status
- Whatever is important to you
I will show you how to create a modular Bash script to display useful information in the status bar. There are a lot of plug-ins you could install for Tmux but engineering things yourself is a lot of fun. I will create a separate function for each status bar item to make the script modular, that way we will only call the functions that we need.
Here is the default status bar.

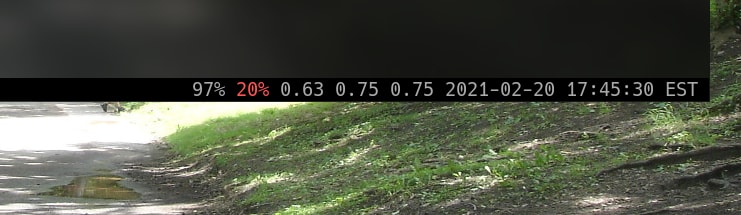
Here is the status bar customized.

Requirments
- lm-sensors
- bc
- acpi
Check your Tmux version. I am using version 2.8.
$ tmux -V
tmux 2.8
If you do not have a .tmux.conf create one in your home directory.
$ touch .tmux.conf
In the .tmux.conf make sure you have the following lines.
# Status bar
set -g status on
set -g status-interval 1
set -g status-justify centre # Careful! It is spelled centre not center.
set -g status-style fg=white,bg=black

# Highlight the current window.
setw -g window-status-current-fg white
setw -g window-status-current-bg red
setw -g window-status-current-attr bright

# Status Bar Left side
set -g status-left-length 65
set -g status-left-style default
set -g status-left "#h #( ~/.tmux/left_status.sh )"

# Status Bar Right side
set -g status-right-length 50
set -g status-right-style default
set -g status-right "#( ~/.tmux/right_status.sh )"
Make a hidden folder in your home directory to save your Bash scripts.
$ mkdir .tmux
Make two Bash scripts, one for the left side, one for the right.
$ touch ~/.tmux/right_status.sh
$ touch ~/.tmux/left_status.sh
The scripts are currently not executable ( rw-r--r-- ).
$ ls -lF ~/.tmux/*.sh
-rw-r--r-- 1 bw bw    0 Feb 19 18:44 /home/bw/.tmux/right_status.sh
-rw-r--r-- 1 bw bw    0 Feb 19 18:44 /home/bw/.tmux/left_status.sh
Make the scripts executable so they will run the chmod command.
$ chmod +x ~/.tmux/right_status.sh
$ chmod +x ~/.tmux/left_status.sh
The scripts are now executable ( rwxr-xr-x ).
$ ls -lF ~/.tmux/*.sh
-rwxr-xr-x 1 bw bw    0 Feb 19 18:44 /home/bw/.tmux/right_status.sh*
-rwxr-xr-x 1 bw bw    0 Feb 19 18:44 /home/bw/.tmux/left_status.sh*
Status Bar Left Side
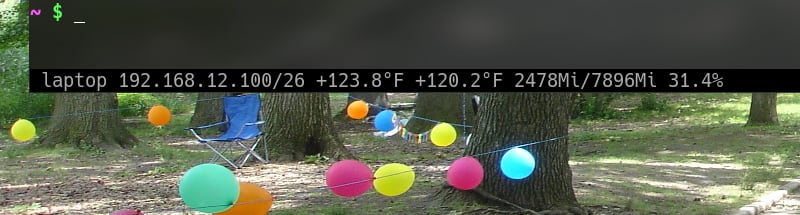
First edit the left_status.sh script. Add the following content. The ip_address function displays the IP address and netmask.
$ vim ~/.tmux/left_status.sh
#!/bin/bash


function ip_address() {

    # Create an empty array.
    interface_arr=()

    # Loop through the available interfaces.
    for i in $(ls -1 /sys/class/net/); do

        # Add every interface to the array except for the loopback device.
        if [ "$i" != 'lo' ]; then

            interface_arr+=($i)

        fi

    done

    # Loop through the array of interfaces. Check to see which interface is up.
    for j in ${interface_arr[@]}; do

        if [ "$(cat /sys/class/net/${j}/operstate)" == "up" ]; then

            local iface="${j}"

        else

            local iface=""

        fi

    done

    if [ ! -z "$iface" ]; then

        # Print the ip address of the interface.
        printf " %s  " "$(ip addr show $iface | awk '/inet /{print $2}')"

    fi

}
Underneath the IP address function add the CPU function. You must install lm-sensors for this to work. Run these two commands.
$ sudo apt install lm-sensors

$ sudo sensors-detect
Run the sensors command to see the output.
# Celcius

$ sensors
acpitz-acpi-0
Adapter: ACPI interface
temp1:        +27.8°C  (crit = +105.0°C)
temp2:        +29.8°C  (crit = +105.0°C)

# Fahrenheit

$ sensors -f
acpitz-acpi-0
Adapter: ACPI interface
temp1:        +82.0°F  (crit = +221.0°F)
temp2:        +85.6°F  (crit = +221.0°F)
Add the cpu_temperature function below the ip_address function.
function cpu_temperature() {

    # Display the temperature of CPU core 0 and core 1.
    sensors -f | awk '/Core 0/{printf $3" "}/Core 1/{printf $3" "}'

}
To see the memory usage we will add a memory_usage function. We need the bc command to calculate the percentage of memory used.
Install bc command.
$ sudo apt install bc
Add the memory_usage function to the script.
function memory_usage() {

    if [ "$(which bc)" ]; then

        # Display used, total, and percentage of memory using the free command.
        read used total <<< $(free -m | awk '/Mem/{printf $2" "$3}')
        # Calculate the percentage of memory used with bc.
        percent=$(bc -l <<< "100 * $total / $used")
        # Feed the variables into awk and print the values with formating.
        awk -v u=$used -v t=$total -v p=$percent 'BEGIN {printf "%sMi/%sMi %.1f% ", t, u, p}'

    fi

}
The next function will display if the VPN is up by checking for the tun0 interface.
function vpn_connection() {

    # Check for tun0 interface.
    [ -d /sys/class/net/tun0 ] && printf "%s " 'VPN*'

}
To complete the left_status.sh script we will use a main function to call the other functions.
function main() {

    # Comment out any function you do not need.
    ip_address
    cpu_temperature
    memory_usage
    vpn_connection

}

# Calling the main function which will call the other functions.
main
Status Bar Right Side
Now let’s configure the right side.
$ vim ~/.tmux/right_status.sh
The battery meter function displays the level of the battery and changes color depending on the battery level.
We need the acpi program for this.
$ apt install acpi
Run acpi to see the output.
$ acpi
Battery 0: Unknown, 96%
Add the battery_meter function to the Bash script.
$ vim ~/.tmux/right_status.sh
#!/bin/bash

function battery_meter() {

    if [ "$(which acpi)" ]; then

        local fgdefault='#[default]'

        if [ "$(cat /sys/class/power_supply/AC/online)" == 1 ] ; then

            local charging='+'

        else

            local charging='-'

        fi

        # Check for existence of a battery.
        if [ -x /sys/class/power_supply/BAT0 ] ; then

            local batt0=$(acpi -b 2> /dev/null | awk '/Battery 0/{print $4}' | cut -d, -f1)

            case $batt0 in

                100%|9[0-9]%|8[0-9]%|7[5-9]%) fgcolor='#[fg=brightgrey]'
                    ;;

                7[0-4]%|6[0-9]%|5[0-9]%) fgcolor='#[fg=brightgreen]'
                    ;;

                4[0-9]%|3[0-9]%|2[5-9]%) fgcolor='#[fg=brightyellow]'
                    ;;

                2[0-4]%|1[0-9]%|[0-9]%) fgcolor='#[fg=brightred]'
                    ;;
            esac

            # Display the percentage of charge the battery has.
            printf "%s " "${fgcolor}${charging}${batt0}%${fgdefault}"

        fi
    fi
}
The next function will add to the script is to get the load average using the uptime command.
function load_average() {

    printf "%s " "$(uptime | awk -F: '{printf $NF}' | tr -d ',')"

}
To see the time, date, and timezone add the date_time function to the Bash script.
function date_time() {

    printf "%s " "$(date +'%Y-%m-%d %H:%M:%S %Z')"

}
The last function is the main function which calls the other functions.
function main() {

    battery_meter
    load_average
    date_time

}

# Calling the main function which will call the other functions.
main
Complete Scripts
$ cat ~/.tmux/left_status.sh
#!/bin/bash


function ip_address() {

    # Create an empty array.
    interface_arr=()

    # Loop through the available interfaces.
    for i in $(ls -1 /sys/class/net/); do

        # Add every interface to the array except for the loopback device.
        if [ "$i" != 'lo' ]; then

            interface_arr+=($i)

        fi

    done

    # Loop through the array of interfaces. Check to see which interface is up.
    for j in ${interface_arr[@]}; do

        if [ "$(cat /sys/class/net/${j}/operstate)" == "up" ]; then

            local iface="${j}"

        else

            local iface=""

        fi

    done

    if [ ! -z "$iface" ]; then

        # Print the ip address of the interface.
        printf "%s " "$(ip addr show $iface | awk '/inet /{print $2}')"

    fi

}

function cpu_temperature() {

    # Display the temperature of CPU core 0 and core 1.
    sensors -f | awk '/Core 0/{printf $3" "}/Core 1/{printf $3" "}'

}

function memory_usage() {

    if [ "$(which bc)" ]; then

        # Display used, total, and percentage of memory using the free command.
        read used total <<< $(free -m | awk '/Mem/{printf $2" "$3}')
        # Calculate the percentage of memory used with bc.
        percent=$(bc -l <<< "100 * $total / $used")
        # Feed the variables into awk and print the values with formating.
        awk -v u=$used -v t=$total -v p=$percent 'BEGIN {printf "%sMi/%sMi %.1f% ", t, u, p}'

    fi

}

function vpn_connection() {

    # Check for tun0 interface.
    [ -d /sys/class/net/tun0 ] && printf "%s " 'VPN*'

}

function main() {

    # Comment out any function you do not need.
    ip_address
    cpu_temperature
    memory_usage
    vpn_connection

}

# Calling the main function which will call the other functions.
main
$ cat ~/.tmux/right_status.sh
#!/bin/bash


function battery_meter() {

    if [ "$(which acpi)" ]; then

        local fgdefault='#[default]'

        if [ "$(cat /sys/class/power_supply/AC/online)" == 1 ] ; then

            local charging='+'

        else

            local charging='-'

        fi

        # Check for existence of a battery.
        if [ -x /sys/class/power_supply/BAT0 ] ; then

            local batt0=$(acpi -b 2> /dev/null | awk '/Battery 0/{print $4}' | cut -d, -f1)

            case $batt0 in

                100%|9[0-9]%|8[0-9]%|7[5-9]%) fgcolor='#[fg=brightgrey]'
                    ;;

                7[0-4]%|6[0-9]%|5[0-9]%) fgcolor='#[fg=brightgreen]'
                    ;;

                4[0-9]%|3[0-9]%|2[5-9]%) fgcolor='#[fg=brightyellow]'
                    ;;

                2[0-4]%|1[0-9]%|[0-9]%) fgcolor='#[fg=brightred]'
                    ;;
            esac

            # Display the percentage of charge the battery has.
            printf "%s " "${fgcolor}${charging}${batt0}%${fgdefault}"

        fi
    fi
}

function load_average() {

    printf "%s " "$(uptime | awk -F: '{printf $NF}' | tr -d ',')"

}

function date_time() {

    printf "%s" "$(date +'%Y-%m-%d %H:%M:%S %Z')"

}

function main() {

    battery_meter
    load_average
    date_time

}

# Calling the main function which will call the other functions.
main
Feel free to leave comment, questions, and suggestions.
This content originally appeared on DEV Community and was authored by brandon_wallace
brandon_wallace | Sciencx (2021-02-20T23:02:33+00:00) Make Your Tmux Status Bar 100% Better With Bash. Retrieved from https://www.scien.cx/2021/02/20/make-your-tmux-status-bar-100-better-with-bash/
Please log in to upload a file.
There are no updates yet.
Click the Upload button above to add an update.