
This content originally appeared on Level Up Coding - Medium and was authored by Thenjiwe kubheka

What comes to mind when you think of Uber? The tech giant that revolutionized the taxi industry? A company that was inspired by a James Bond movie or convenience!
Yes you heard me, Uber was inspired by the James Bond movie Casino Royal.
One of the founders of Uber Garrett Camp was very frustrated with the Taxi service, and one day while watching Casino Royal, he noticed James bond use a cellphone to track the location of a car. He thought to himself, how cool would it be if I could push a button on my phone and watch my cab arrive.
Here we are today! We have an on-demand taxi service, by just a push of a button. In this article, we will explore the engineering of particular features behind Uber.
Calculating The ETA
That magic feature, when you take out your phone; open the Uber app and request a ride, then those clever little algorithms tell you how long will it take for your driver to arrive.
The Estimated Time Of Arrival, is quite accurate most of the time. So how does Uber get it right?
Wandile is an Uber driver in Johannesburg South. I also live in Johannesburg South. When I request a taxi, a map is shown on my device and Wandile’s device, with our locations.
The maths in the background is as follows;
Cities are edges and nodes;
Nodes represent intersections and edges are streets. In computer science, we call these graph problems.
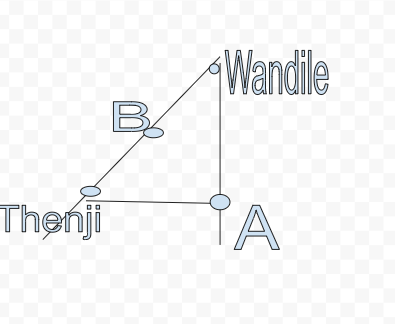
The picture above represents my location and my driver Wandile’s location. The dots are nodes(intersections) and lines are edges(streets). We call these graphs in Computer Science. Now which route is faster for Wandile to my location?
If we are going to use Dijkstra’s algorithm, then we need to calculate all the options, while integrating speed. If the speed limit between Wandile and A is 80km/h. And the speed limit between Wandile and B is 20km/h, then B and Thenji 10km/h.
The 80km/h edge will be favored against the combined 30km/h edge. This according to Dijkstra’s algorithm. But speed is not our only problem, we have to consider traffic. Not forgetting whether, such as extreme rainfall or snow.
This method is not feasible for delivering accurate real time ETA’S to clients. This has been coined by computer scientists as the NP-complete problem.
A much better approach would be using historical data for ETA calculations. These use datasets from previous trips and play around with probability. The has been a trip similar to mine, in my region using the same route.
The need for graphs and their algorithms would only be needed if Uber where to introduce their service in a new city. Operating in a new city we do not have enough data to train algorithms to recognize historical patterns.
In this special case we segment the city into smaller parts, creating smaller graphs. This will reduce our algorithmic running time and give much more accurate ETA’s.
Once the mapping and routing problem has been solved, time to move on to finding and matching customers to drivers.
Finding And Matching Customers To Drivers
We would like to think that, once I make a request the nearest driving will be pinged right. Wrong!
Langa is the nearest driver to me, but Wandile was pinged by the system. This is known as batched matching. This was introduced to reduce the total wait time.
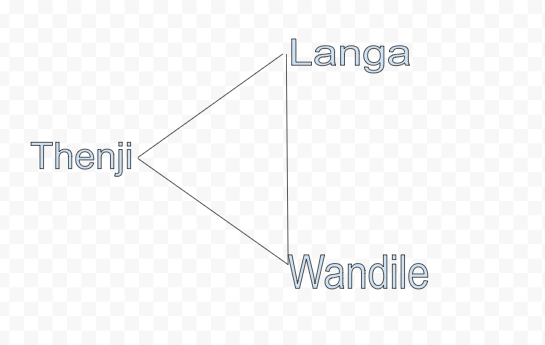
At first the system was not really intelligent it matched the nearest driver which is Langa to me. Langa is 5 minutes away from me and Wandile 10. The system would ping Langa and he would accept the request and fetch me.
This little triangle is not a reflection of the real world, requests happen simultaneously.
Here is a more accurate reflection:
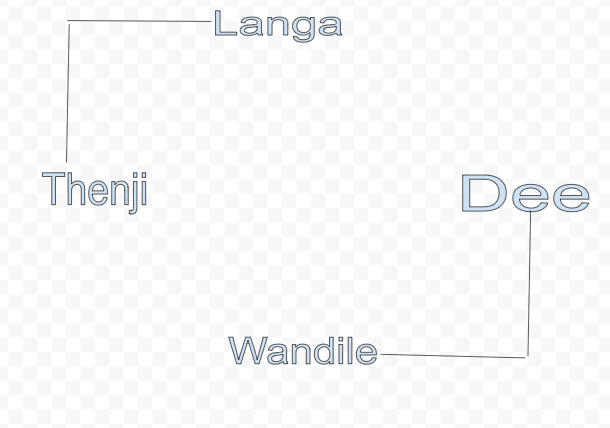
Langa is 5 minutes away from me, accepts the request and is dispatched. We also have my dear friend Dee from the other side of town requesting a ride. Wandile is 10 minutes away from Dee.
The total wait time for the two requests is 15 minutes. This is what we call the worst case in computer science. Lets recomputed this!
Langa is only 3 minutes away from Dee and Wandile is 7 minutes away from Thenji. This gives us a total waiting time of 10 minutes, better than the other waiting time.
The batching algorithm works to reduce waiting time as much as possible. If Langa is matched to Dee and Thenji to Wandile the total weight time is reduced by 5 minutes.
Logging
A logging layer is used for business and legal purposes.
Business Purposes
Think big data analytics, using this to see how drivers move and routes. This is done in the name of improving customer experience.
Legal Purposes
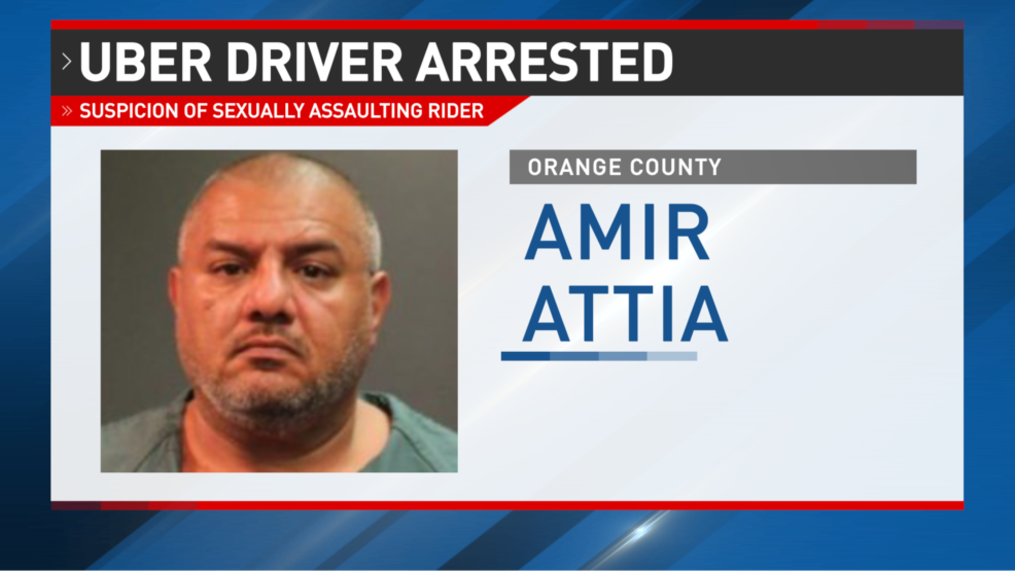
The picture above reveals a sad but true narrative of women falling victim to sexual predators. Uber last released statistics over the period of 2017 and 2018.
During that time period there where nearly 6000 reported sexual assaults, during or after an Uber ride.
Breaking it down, these ranged from rape to groping. Rape being reported 464 times.
This issue does not only affect Uber but every ride services company. This surely was a problem even before integrating Tech into the taxi industry. Now how can logging help us with this issue?
Logging happens at end points, which is the drivers device and the clients device.
Thenji requests an Uber and the sexual predator Fannie is assigned to me! As I hope into the car. I do not know I am with a sexual predator that have cruel intentions! At that time I am with him in the taxi my device and his device show we at the same location at the same time.
The estimated time for the trip has already been calculated, if it takes longer and we detour, or are at some designated location for a period of time and I allege rape after that, the data collected by the logging layer can be used as evidence in a rape case.
Can the logging layer and other features be improved, to aid women's safety?
There is always room for improvement, essentially the is the purpose of the logging layer.
Handling Big Data
Storage
Lets begin with storage to handle this big data, we need to store our trip data as efficiently as possible.
A trip is stored in at least 2 data centers, the primary data center is as close as possible to the trip. If a trip happens in Johannesburg, the data center would be in Johannesburg or Cape Town.
The backup data center would be in Europe or Asia. When I take a trip, the trip information from my device and the drivers device will be stored in the primary data center, in South Africa.
Now for some reason the data center is South Africa is offline, then the trip information/data will be sent to the backup data center in Europe. Once our South African data center gets back online, the information is synched back to the South African data center.
Worst case is if both data centers are offline, then that's when you see the message Offline.
A mix of SQL and no SQL are used, Apache Cassandra for no SQL and an Uber forked MySQL which is schemaless.
For big data analytics hardoop is used as the data warehouse. The data warehouse is decoupled from the main system. If it is offline, then it is should not affect the day to day business of Uber.
Caching
This can be used to deliver static data to clients, and place them closer to clients. We can use these for customers but not divers and driver positions. As you can imagine these change frequently.
I think this covers the basics of the engineering, behind Uber. Maybe next time we can dig deep and discuss other revolutionary features.
Additional Reading
How Uber’s Engineering Works was originally published in Level Up Coding on Medium, where people are continuing the conversation by highlighting and responding to this story.
This content originally appeared on Level Up Coding - Medium and was authored by Thenjiwe kubheka
Thenjiwe kubheka | Sciencx (2021-09-05T16:31:31+00:00) How Uber’s Engineering Works. Retrieved from https://www.scien.cx/2021/09/05/how-ubers-engineering-works/
Please log in to upload a file.
There are no updates yet.
Click the Upload button above to add an update.