
This content originally appeared on DEV Community and was authored by Ankit Anand ✨
OpenTelemetry provides a set of APIs to directly measure the performance and behavior of your software and send this data to observability platforms. Let's learn how to get started with OpenTelemetry for Go applications and visualize that data with SigNoz.
OpenTelemetry is a vendor-agnostic instrumentation library. In this article, let's explore how you can instrument your Go application with OpenTelemetry and get the data reported through SigNoz - an open-source APM and observability tool.
Steps to get started with OpenTelemetry for Go application
- Installing SigNoz
- Installing sample Go application
- Instrumentation with OpenTelemetry and sending data to SigNoz
Installing SigNoz
You can get started with SigNoz using just three commands at your terminal if you have Docker installed. You can read about other deployment options from SigNoz documentation.
git clone https://github.com/SigNoz/signoz.git
cd signoz/deploy/
./install.sh
You will have an option to choose between ClickHouse or Kafka + Druid as a storage option. Trying out SigNoz with ClickHouse database takes less than 1.5GB of memory, and for this tutorial, we will use that option.
When you are done installing SigNoz, you can access the UI at: http://localhost:3000
The application list shown in the dashboard is from a sample app called HOT R.O.D that comes bundled with the SigNoz installation package.
 SigNoz dashboard
Installing sample Go application
To see how OpenTelemetry can be used to instrument a Go application, let's see how it works with a sample bookstore app (GitHub repo).
It is a simple bookstore app with a REST API that provides book data and performs CRUD operations. The app uses Gin framework to build a RESTful API. Gin is a high-performance HTTP web framework written in Golang containing a set of commonly used functionalities like routing, middleware support and rendering.
OpenTelemetry has specific instrumentation packages to support popular Go packages and use cases. For example, this app uses the Gin framework for request routing. OpenTelemetry provides instrumentation package named otelgin to instrument the Gin framework which you need to import in your app. You can find the complete list of supported Golang packages here.
Prerequisites
Verify if you have Golang installed on your machine by running $ go version on your terminal. If you don't have Golang installed, you can download it here.
Steps to install sample Go application:
- Clone sample Go application repository From your terminal use the following command to clone sample Go application GitHub repository.
git clone https://github.com/SigNoz/sample-golang-app.git
- Update path to sample-golang-app & check if the app is working Update your terminal path to the sample app directory and check if the app is working or not using the following command:
   cd sample-golang-app
   go run main.go
Make sure you have an available port for running your app. If, by default, the go app tries to run on port 8080, you might get an error as SigNoz uses port 8080 for its query service. On your mac terminal, you can set the listening port of your app by using the following command:
export PORT = 8081
 /books endpoint of our bookstore app
Once you ensure that your application is working, exit the server by pressing 'Ctrl + C' on your mac terminal.
Instrumentation with OpenTelemetry and sending data to SigNoz
The file main.go has instructions to import all the necessary OpenTelemetry packages in order to instrument the sample app. For this app, we import the following OpenTelemetry packages.
import (
    "go.opentelemetry.io/contrib/instrumentation/github.com/gin-gonic/gin/otelgin"
    "go.opentelemetry.io/otel"
    "go.opentelemetry.io/otel/exporters/otlp"
    "go.opentelemetry.io/otel/exporters/otlp/otlpgrpc"
    "go.opentelemetry.io/otel/label"

    "go.opentelemetry.io/otel/sdk/resource"
    sdktrace "go.opentelemetry.io/otel/sdk/trace"
)
You need to run the Go app with the necessary environment variables in order to start sending data to SigNoz. Use the following command to run and configure the app to send data to SigNoz:
SERVICE_NAME=goApp INSECURE_MODE=true OTEL_METRICS_EXPORTER=none OTEL_EXPORTER_OTLP_ENDPOINT=<IP of SigNoz backend>:4317 go run main.go
Ip of SigNoz can be replaced with localhost in this case. Hence, the final command becomes:
SERVICE_NAME=goApp INSECURE_MODE=true OTEL_METRICS_EXPORTER=none OTEL_EXPORTER_OTLP_ENDPOINT=localhost:4317 go run main.go
And, congratulations! You have instrumented your sample Golang app. Hit the /books endpoint of the bookstore app at http://localhost:8081/books. Refresh it a bunch of times in order to generate load, and wait for 1-2 mins for data to appear on SigNoz dashboard.
You can now access the SigNoz dashboard at http://localhost:3000 to monitor your app for performance metrics.
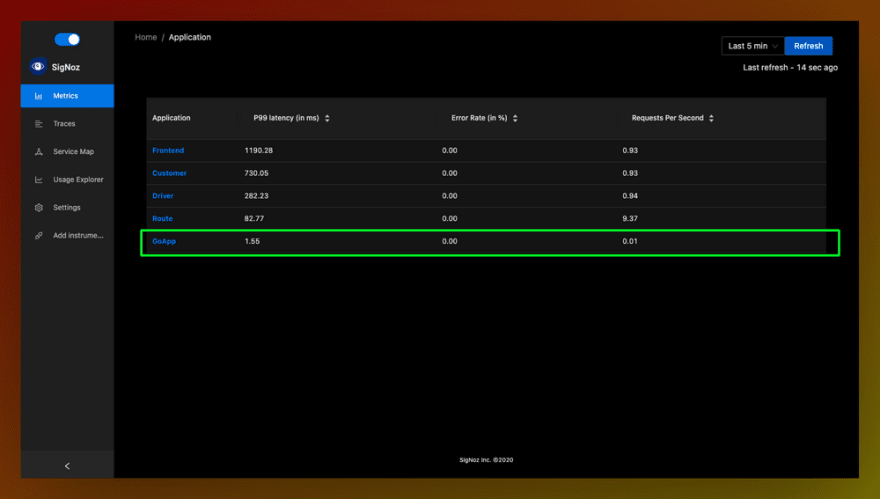 Sample Golang app appears in the list of application
If you want to instrument your own Golang application, you can read about it in our documentation.
Metrics and Traces of the Go application
SigNoz makes it easy to visualize metrics and traces captured through OpenTelemetry instrumentation.
SigNoz comes with out of box RED metrics charts and visualization. RED metrics stands for:
- Rate of requests
- Error rate of requests
- Duration taken by requests
 Measure things like application latency, requests per sec, error percentage and see your top endpoints
You can then choose a particular timestamp where latency is high to drill down to traces around that timestamp.
 View of traces at a particular timestamp</figcaption
You can use flamegraphs to exactly identify the issue causing the latency.
 Flamegraphs showing exact duration taken by each spans - a concept of distributed tracing
Conclusion
OpenTelemetry makes it very convenient to instrument your Go applications and generate telemetry data. You can then use an open-source APM tool like SigNoz to analyze the performance of your app. As SigNoz offers a full-stack observability tool, you don't have to use multiple tools for your monitoring needs.
You can try out SigNoz by visiting its GitHub repo ?
If you face any issues while trying out SigNoz, feel free to write to us at: support@signoz.io
If you want to read more about SigNoz ?
Monitor your Spring Boot application with OpenTelemetry and SigNoz
This content originally appeared on DEV Community and was authored by Ankit Anand ✨
Ankit Anand ✨ | Sciencx (2021-09-06T13:09:14+00:00) Monitor your Golang application with OpenTelemetry and SigNoz. Retrieved from https://www.scien.cx/2021/09/06/monitor-your-golang-application-with-opentelemetry-and-signoz/
Please log in to upload a file.
There are no updates yet.
Click the Upload button above to add an update.