
This content originally appeared on Twilio Blog and was authored by Ismael Hernández Muñoz
A Canary Deployment is a deployment technique to reduce the risk of deploying a new version of an application or service into production. The new version, referred to as the canary, is first rolled out to a small subset of users.
The application is monitored for errors or other anomalies that may have been introduced by the new software version. If none are detected, then the new version can be rolled out to the entire infrastructure and made available to everybody. This process is explained with the diagram below:

However, the monitoring required to determine whether a new release can be rolled out to everybody can be difficult. To make sure the new changes do not introduce any issues, developers must analyze metrics such as system resource usage, latency, or application errors.
Metrics produced by the canary version are compared to the previous version to find any significant differences between the two. This monitoring and analysis can be both time-consuming and prone to human error.
This is where Kayenta comes into place. Kayenta is an open source tool developed by Netflix that performs automated canary analysis. It collects a list of metrics reported by the new and previous versions and compares them using statistical methods in order to produce an overall result.
In this article, we will learn how to automate our canary analysis using Kayenta to make them more reliable and faster.
Tutorial Requirements
- Git.
- A data analytics platform account and API key. For this article, Datadog will be used.
- Yarn.
- Docker.
- Docker Compose.
- Node.js version 10 or higher.
Set up the project environment
To download Kayenta, you can clone the GitHub repository:
git clone https://github.com/spinnaker/kayenta
We will also use Referee, a UI for Kayenta. To download it, clone the Github repository:
git clone https://github.com/Nike-Inc/referee
You will also need an infrastructure with two hosts to deploy the new and previous versions to. These hosts could be Amazon EC2 instances, for example. Your hosts should have the datadog-agent installed and configured so that the hosts are emitting system metrics to Datadog.
Kayenta Configuration
First, we need to configure Kayenta to know where to store the results and which type of metrics to collect. Navigate to the configuration file within the kayenta-web/config subfolder. Open the kayenta.yml file in a code editor. To enable local storage, add the following lines to the memory section of the file:
memory:
    enabled: true
    accounts:
      - name: in-memory-store-account
        supportedTypes:
          - OBJECT_STORE
          - CONFIGURATION_STORE
Next, add the following to configure Kayenta to use Datadog as a metric source. Make sure to change the API key and application key with your own values.
datadog:
    enabled: true
    metadataCachingIntervalMS: 900000
    accounts:
      - name: datadog-account
        apiKey: YOUR_DATADOG_API_KEY
        applicationKey: YOUR_DATADOG_APP_KEY
        supportedTypes:
          - METRICS_STORE
        endpoint.baseUrl: https://app.datadoghq.com
Build and run Kayenta and Referee
The next step is to build and run Kayenta and Referee.
To build Kayenta, run the following commands in a terminal window from Kayenta root folder:
cp kayenta-web/config/kayenta.yml ~/.spinnaker/kayenta.yml
docker-compose up
Open a new tab in the terminal to run Referee. Navigate to the root folder of the referee folder and run the following:
yarn && yarn bootstrap
yarn start
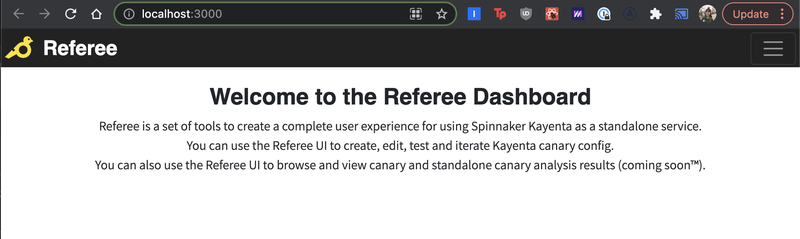
You should see the following on http://localhost:3000/:
Start a canary analysis
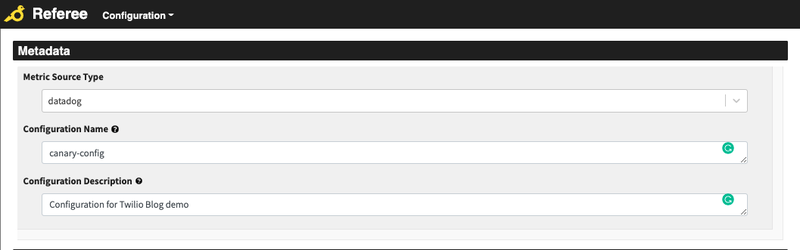
At this point, we’re all set to do our first canary analysis. On the http://localhost:3000/ page, click on Configuration and choose the option to Create a New Kayenta Canary Config. Select Datadog as the metric source type and give your configuration a description.
In this article, the Metric Source Type is set to "datadog", the Configuration Name is "canary-config", and the Configuration Description is "Configuration for Twilio Blog demo" as seen in the screenshot below:
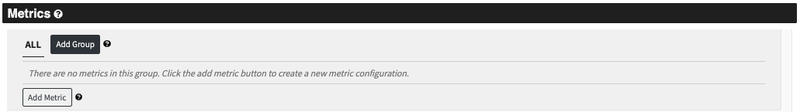
Next, we will add the list of metrics we want to analyze.
Click on the Add Group button to create a group. Groups are used for the grading of the analysis and to sort the metrics by some criteria.
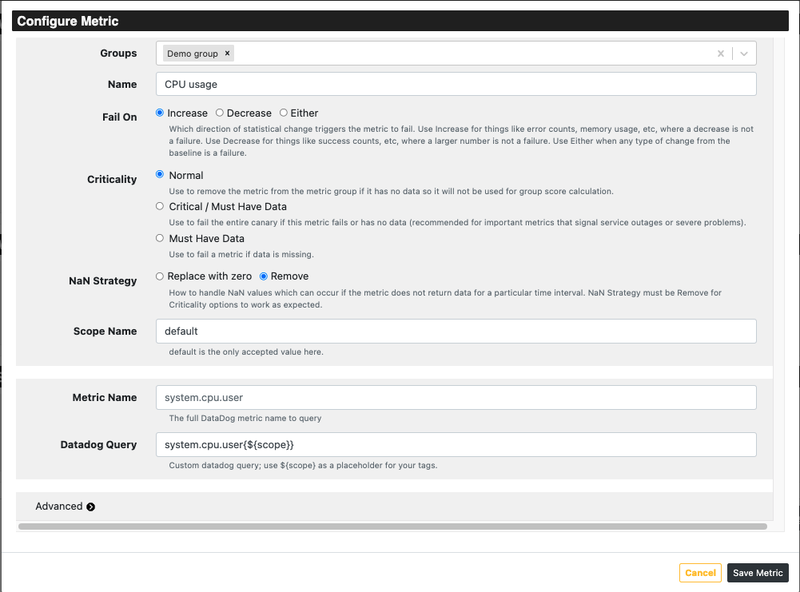
Then, click on Add metric and fill out the form. In this example, we fill it out with Groups as “Demo group”, Name as “CPU usage”, Fail On as “Increase” (this means that if the canary values increase compared to the baseline, the metric will fail), and the Datadog Query, which for CPU usage is "system.cpu.user". The ${scope} value inside the Datadog Query field is used as a placeholder which will be automatically resolved by Kayenta during the analysis.
Click on the Save Metric button in the bottom right corner when you are done.
Once you’ve added all the metrics you want to analyze, weigh your groups. You can weigh them based on the number of metrics they have or how important they are. If you have multiple groups, make sure they add up to 100. 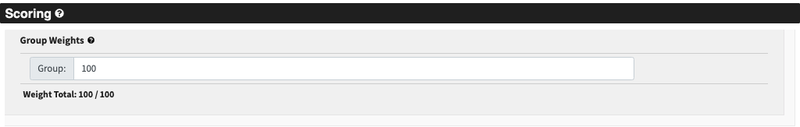
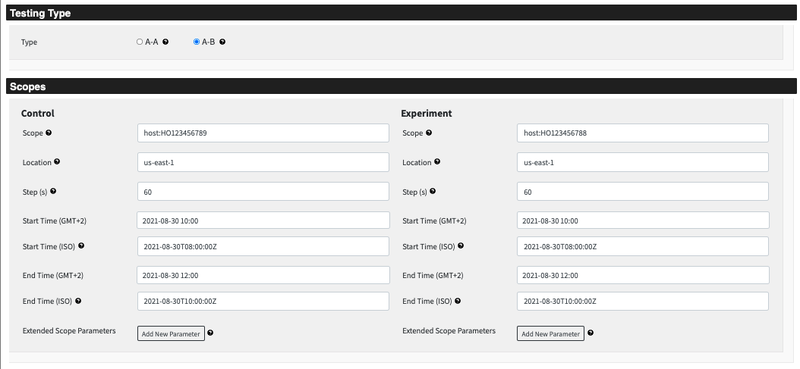
Now, click on Test Config to move on to the last step. This is where we will define our canary and control scopes, and the duration of the analysis.
Select A-B as the testing type to compare different scopes and fill out the form. The control scope and experiment scope should contain the tag used to identify the canary and baseline hosts. In this example, Datadog’s host tag is used.
Input the location of the hosts and give it a start and end time to perform the analysis.
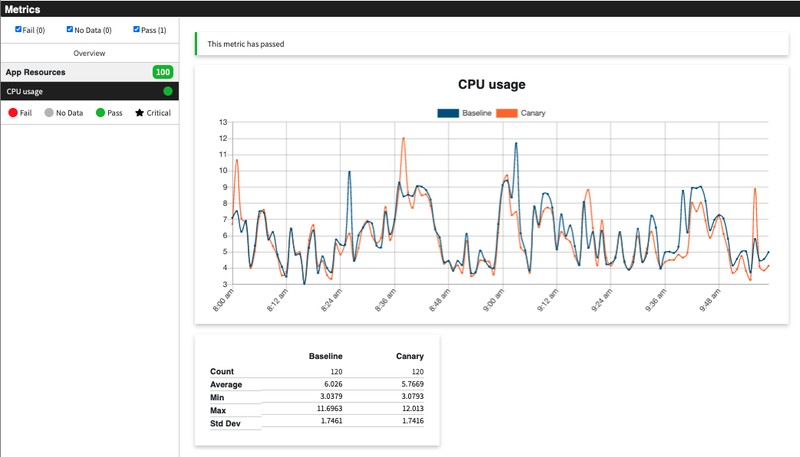
Click on Run Manual Execution after filling out the scopes. The results should appear within seconds. As you can see in the following example, the CPU usages of the canary and baseline follow a similar distribution, there’s no significant degradation in performance, so the result is a Pass.
What's next for canary analysis?
Congratulations on your first canary analysis! If you are a developer working in services that require high availability, then you have an idea of how important it is to have a strong and reliable deployment pipeline.
If you would like to integrate Kayenta into your deployments, or simply want to learn more about it, you can read more about Automated Canary Analysis on Netflix's tech blog or this Medium article about automating canary analysis for deployment.

Ismael Hernández Muñoz is a Software Development Engineer Intern in the Video team. During his internship, he helped make his team’s deployments more reliable and less prone to errors. He is passionate about learning new technologies and growing as an engineer. He can be reached on LinkedIn.
This content originally appeared on Twilio Blog and was authored by Ismael Hernández Muñoz
Ismael Hernández Muñoz | Sciencx (2021-09-08T22:12:29+00:00) How to Run a Canary Analysis with Kayenta. Retrieved from https://www.scien.cx/2021/09/08/how-to-run-a-canary-analysis-with-kayenta/
Please log in to upload a file.
There are no updates yet.
Click the Upload button above to add an update.