
This content originally appeared on DEV Community and was authored by Jones Zachariah Noel
CloudWatch RUM was recently launched during re:Invent 2021 which provides insights to your web-application about certain metrics based on user-actions and errors for debugging.
You can read about the announcement.
 Jeff Barr ☁️ (@ 🏠 ) 💉@jeffbarr
 New – Real-User Monitoring for Amazon CloudWatch - aws.amazon.com/blogs/aws/clou… #AWS #reInvent
"You simply register your application, add a snippet of JavaScript to the header of each page, and deploy."18:19 PM - 29 Nov 2021


Key takeways from the blog
Understanding CloudWatch RUM
CloudWatch Real-User Monitoring (RUM) is a monitoring functionality facilitated by CloudWatch which has always been the monitoring tool on AWS. RUM enables developers and DevOps engineers to understand the issues/errors encountered on the web-app and also insights such as which device or browser or location had the error. Additionally, there is performance insights and the time taken for a file to load on the client side along with the geographically information.
As Jeff Barr quotes it, it's that simple to implement on the client side.
You simply register your application, add a snippet of JavaScript to the header of each page, and deploy.
The CloudWatch RUM consolidated and provides dashboard which gives you a detailed insights such as - page load speed, geographic info, devices, browsers, average load during the time, user journey. All this with just a snippet of JS to page.
Setting-up RUM
CloudWatch Real-User Monitoring (RUM) setup can be summarized with the 3 steps -

Add app monitor
While adding a new app monitor, you would have to specify details such as - app monitor name, app domain and an option to include the sub-domains of the app domain.
You can choose what all data is been collected and stored as telemetry data for the dashboards.

The telemetry data is stored only for 30 days, so if you would wish to store the logs, you can create a CloudWatch log event which captures and stores all these datas.

CloudWatch RUM needs authorization to access AWS resources, for which Amazon Cognito Identity Pools are used.

The telemetry data of the web-pages can also be fine grained to the choice of all pages, specific pages only or exclude certain pages.

Adding the JS snippet to your web app
Once you save the configurations and add the app monitor, you would be presented with a JavaScript snippet.

As simple as it is, this just needs to be added to the <head> of your web-page which is sending telemetry data using the <script> tag.
Monitor the web-app from CloudWatch console
Once set-up and moved your web-page to the server, you can navigate to your CloudWatch console to view the dashboard.
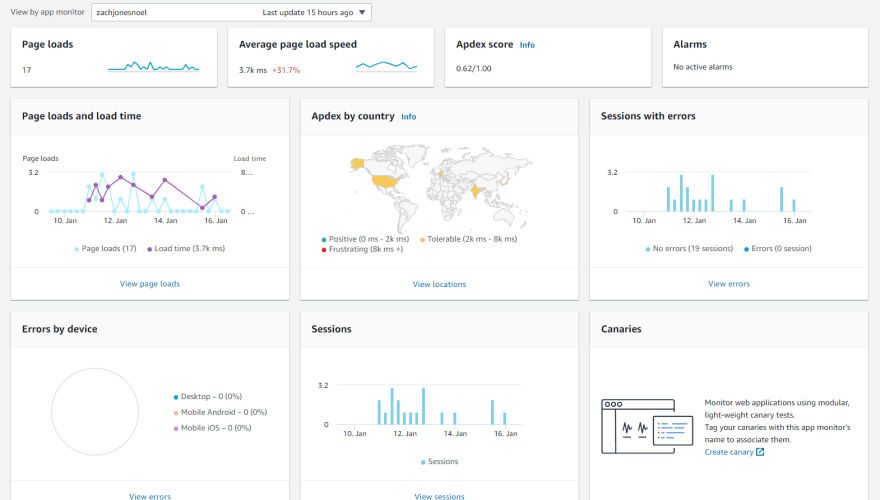
Different telemetry data
From your CloudWatch console, you can view different types of insights. The previous section shows the overview of your app monitor.
Page load speed data for 1 month (Dec 17th 2021 - Jan 16th 2022)

Different web vitals for 1 month (Dec 17th 2021 - Jan 16th 2022)

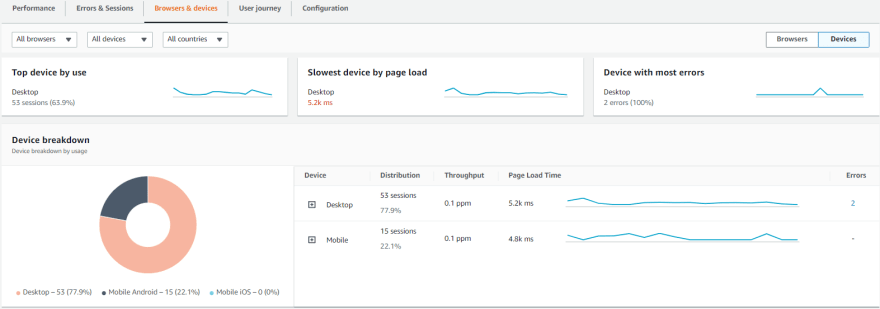
Different web browsers used for 1 month (Dec 17th 2021 - Jan 16th 2022)

Different devices used for 1 month (Dec 17th 2021 - Jan 16th 2022)
Different locations with page load time for 1 month (Dec 17th 2021 - Jan 16th 2022)
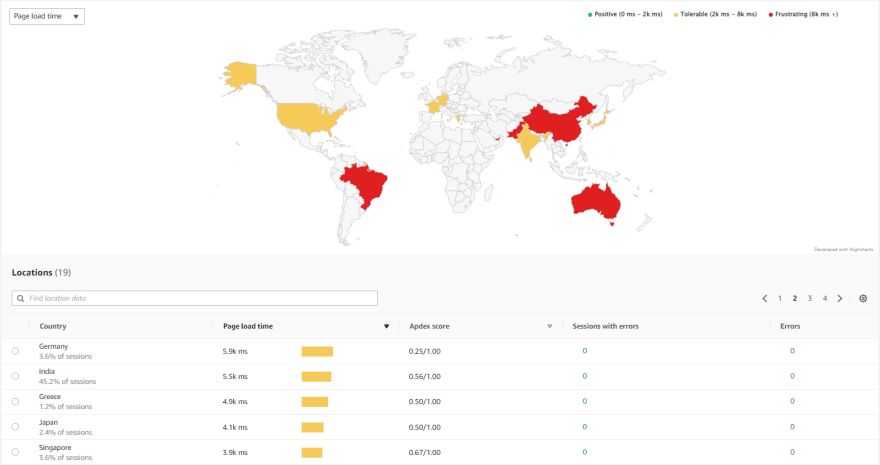
Different locations with sessions for 1 month (Dec 17th 2021 - Jan 16th 2022)

You can view the details at a country filter of sessions for 1 month (Dec 17th 2021 - Jan 16th 2022)

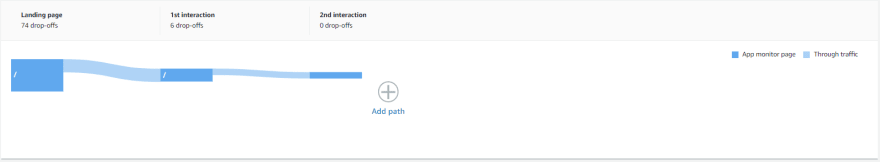
For multiple pages, you can even get the user-journey.
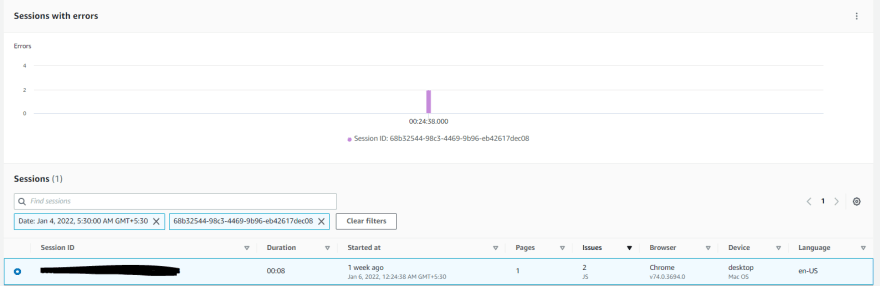
For the sessions with errors, you can view what the error was and also the data time of occurrence along with device details.

Pricing
The free trial has 1 million RUM events which is across the account. And this is only for the first time when RUM is used. Post which, $1 per 100k RUM events.
You can view the detailed pricing details.
Wrap-up
CloudWatch RUM has provided a simplistic approach to web-app insights. The above sample logs and telemetry data are of my personal landing page https://zachjonesnoel.com which has been up and running from Dec 01 2021 and this dashboard has facilitated me to understand what and how is the performance.
Jeff Barr writes about the New – Real-User Monitoring for Amazon CloudWatch.
This content originally appeared on DEV Community and was authored by Jones Zachariah Noel
Jones Zachariah Noel | Sciencx (2022-01-16T12:03:15+00:00) CloudWatch RUM for all insights. Retrieved from https://www.scien.cx/2022/01/16/cloudwatch-rum-for-all-insights/
Please log in to upload a file.
There are no updates yet.
Click the Upload button above to add an update.