
This content originally appeared on Level Up Coding - Medium and was authored by Li
Debugging is an important skill.

If you also want to become a Senior Front-end developer, mastering debugging is a key skill. It will help you understand how the program works and gradually improve your coding level.
For complex open source projects, using debugging can quickly understand the role of the code and the author’s intention, help you understand its internal principles, make you continue to advance in programming, and finally become a senior front-end developer and get a higher salary.
Overview
Debugging has a lot to introduce in Node.js direction and web direction, so I decided to divide this series of articles into the following:
- This article (I will focus on how to debug Node.js programs in VS Code)
- Debug web programs in VS Code or Chrome DevTools, including but not limited to React, Vue.
- Debug-related principles include SourceMap and so on.
Due to personal energy reasons, I will update and complete the links to these articles in the future, so stay tuned. If you want to get timely updates, please don’t forget to follow me.
Quick Start
VS Code has a powerful built-in Node.js debugger, you can debug Node.js programs or web programs without installing any extensions.
You can see that we can easily start the debugger in VS Code, Let me introduce it in detail.
Launch Configurations
First, you can see I created a launch configuration file in the gif, it’s useful because it allows you to configure and save debugging setup details. Next, we selected Node.js, VS Code automatically generated the corresponding configuration, go back to the File Explorer view you’ll see that VS Code has created a .vscodefolder and added the launch.json file to your workspace.
In the launch.json configuration file, the debugging modes can be divided into two core modes, Attach and Launch.
The attach mode needs to prepare a debugging server in advance. We can start the app in debug mode to get the debugging server, and then connect to the VS Code debugger through the program port, while the launch helps us do all this, directly helping us start the app in debug mode, so the launch mode can meet most usage scenarios.
There are a lot of Launch.json attributes, you can find their detailed descriptions in the VS Code official documentation.
In this demo project, I will use the following configuration.
{
  "version": "0.2.0",
  "configurations": [
    {
      "type": "pwa-node",
      "request": "launch",
      "name": "Launch Program",
      "skipFiles": ["<node_internals>/**"],
      "program": "${file}"
    }
  ]
}
Breakpoint Options
Breakpoints can be toggled by clicking on the editor margin of the current line, if it is a right mouse click an options menu will appear.
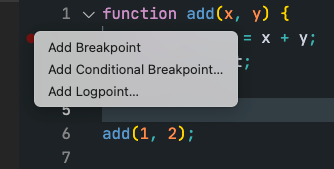
The first option has the same effect as clicking with the left mouse button.
The second option is to add a conditional breakpoint. You can enter a JavaScript expression later. This breakpoint will take effect only when the expression result is true.
The third option is Logpoints, which is a variant of a breakpoint that does not “break” into the debugger but instead logs a message to the console. Logpoints are especially useful for injecting logging while debugging production servers that cannot be paused or stopped.
Debugging App
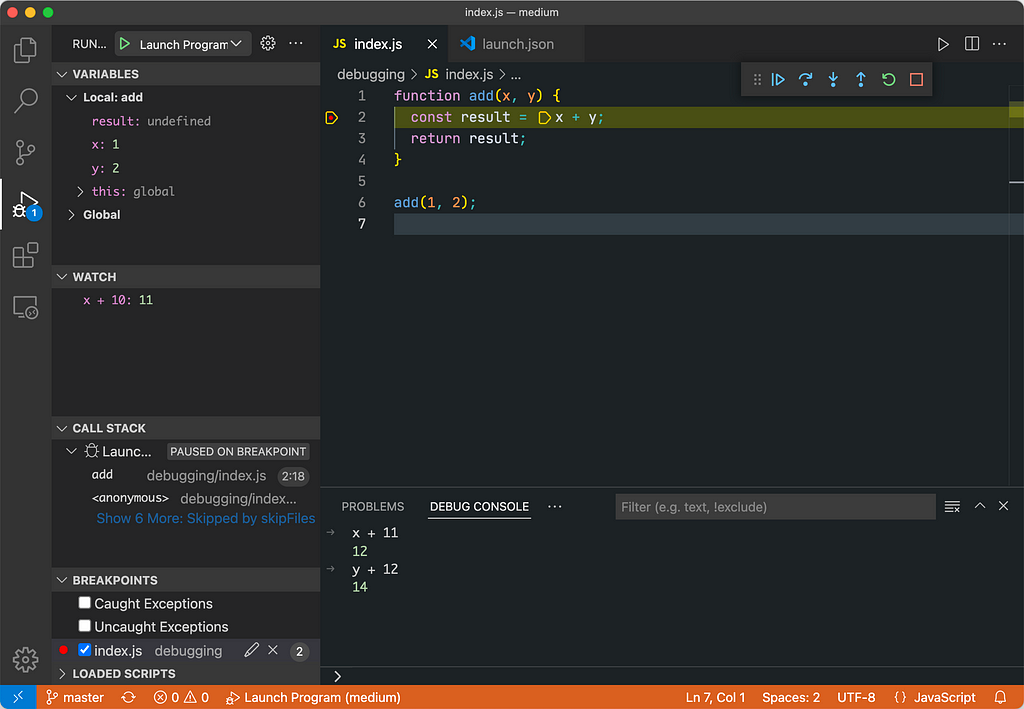
Now we can start debugging, we can use the shortcut key F5 or the start button on the left to start it.
When the program runs to the breakpoint, it will stop. At this time, the screenshot is as follows.
Left Panel
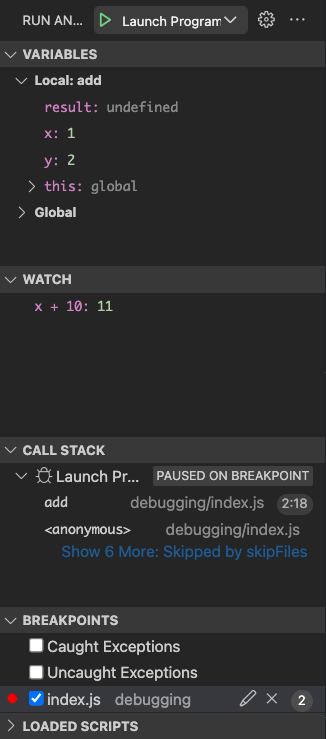
- Variables
Here you can view all accessible environment variables under the current breakpoint, they may come from the current scope, closure scope, global scope, etc.
- Watch
Here you can add variables or evaluate expressions and watch their values in the context of the current breakpoint. This is a very useful feature if we want to do some expression evaluation outside of code logic.
- Call stack
Here you can view the call stack of the current function, which is very helpful to clarify the order of function calls.
- Breakpoints
A list of all files with breakpoints is included here. If uncaught exceptions are checked, it means that if an uncaught exception occurs in the program, it will stop at the line where the exception occurred. The same is true for Caught Exceptions, but it only represents the caught exception.
Debug Actions
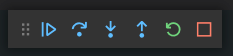
You can control the debug behavior by clicking these icons. They are as follows:
- Continue / Pause F5
It means continuing to run the code until the next breakpoint is hit.
- Step Over F10
Skip the current function execution according to the code execution logic and directly execute the next statement.
- Step Into F11
When the breakpoint reaches the function, you can use this option to jump into the execution of the function to see what’s going on inside the function.
- Step Out Shift+F11
Can jump out of the current function during execution.
- Restart Ctrl+Shift+F5
- Stop Shift+F5
Debug Console REPL
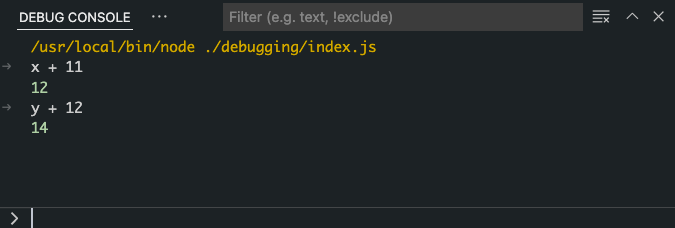
This area is called the Debug Console REPL, where you can get variables in the current breakpoint environment and combine them to execute expressions.
That’s all for today. As mentioned above, I will update how to debug web programs and explain debug-related principles to you in the future. Finally, remember to follow me for timely updates. Thank you.
Want to Become a Senior FrontEnd Developer? You Must Master Debugging! was originally published in Level Up Coding on Medium, where people are continuing the conversation by highlighting and responding to this story.
This content originally appeared on Level Up Coding - Medium and was authored by Li
Li | Sciencx (2022-02-22T13:10:18+00:00) Want to Become a Senior FrontEnd Developer? You Must Master Debugging!. Retrieved from https://www.scien.cx/2022/02/22/want-to-become-a-senior-frontend-developer-you-must-master-debugging/
Please log in to upload a file.
There are no updates yet.
Click the Upload button above to add an update.