
This content originally appeared on DEV Community 👩💻👨💻 and was authored by Mads Stoumann
I'm currently reading Science Illustration — A History of Visual Knowledge from the 15th Century to Today. Highly recommended! Great books on science and/or design, are always a source of inspiration for me.

The book is a treasure trove of great illustrations — and some of them are just meant to be coded in <svg>! ... like this one (sorry for the bad quality, picture taken with my phone):

Luckily, it's not overly complex to do in <svg>.
We just need a bit of Math and JavaScript.
To start with, we need a canvas:
<svg viewBox="0 0 1000 1000"></svg>
Now, we need some data!
The viewBox has a size of 1000, and we need 16 points around the circle:
const size = 1000;
const radius = size / 2;
const numOfPoints = 16;
Next, let's create an array of points:
  const data = [...new Array(numOfPoints)].map((_a, index) => {
    const angle = 360 / numOfPoints;
    const radian = angle * (index + 1);
    return polarToCartesian(radius, radian)
  })
We need a small helper-method, polarToCartesian, to get the coordinates of our 16 points:
const polarToCartesian = (r, degrees) => {
    const radians = degrees * Math.PI / 180.0;
    return [r + (r * Math.cos(radians)), r + (r * Math.sin(radians))]
  }
A method like this typically needs x and y as well, but since these are the same as radius (in this case), we can go for a simpler version.
Cool, now we have an array of arrays:
[
  [961.9397662556433, 691.3417161825449],
  [853.5533905932738, 853.5533905932737],
  ...etc,
]
For each point, we need to draw a line to all the other points, feeding in the X and Yof the current point:
const renderLines = (X,Y) => {
    return data.map(entry => {
      const [x,y] = entry;
      if (X !== x && Y !== y) return `<line x1="${X}" y1="${Y}" x2="${x}" y2="${y}"></line>`
    })
  }
Now, the only thing remaining is to call that method and set the returned string as innerHTML of our <svg>:
svg.innerHTML = data.map(entry => {
    const [x,y] = entry;
    return renderLines(x,y).join('');
  })
Let's see what we've built:

Looks great, but a bit dull! Let's add a method for generating random values between a min and a max-range:
const random = (max, min = 0) => Math.floor(Math.random() * (max - min) + min);
... and then use it to create random colors and stroke-widths:
const stroke = `hsl(${random(360)}, ${random(100, 50)}%, ${random(90, 30)}%)`;
const strokeWidth = random(30, 3) / 10;

Much better! Let's try to change the numberOfPoints-variable to a much lower value:

Or perhaps a much higher value?
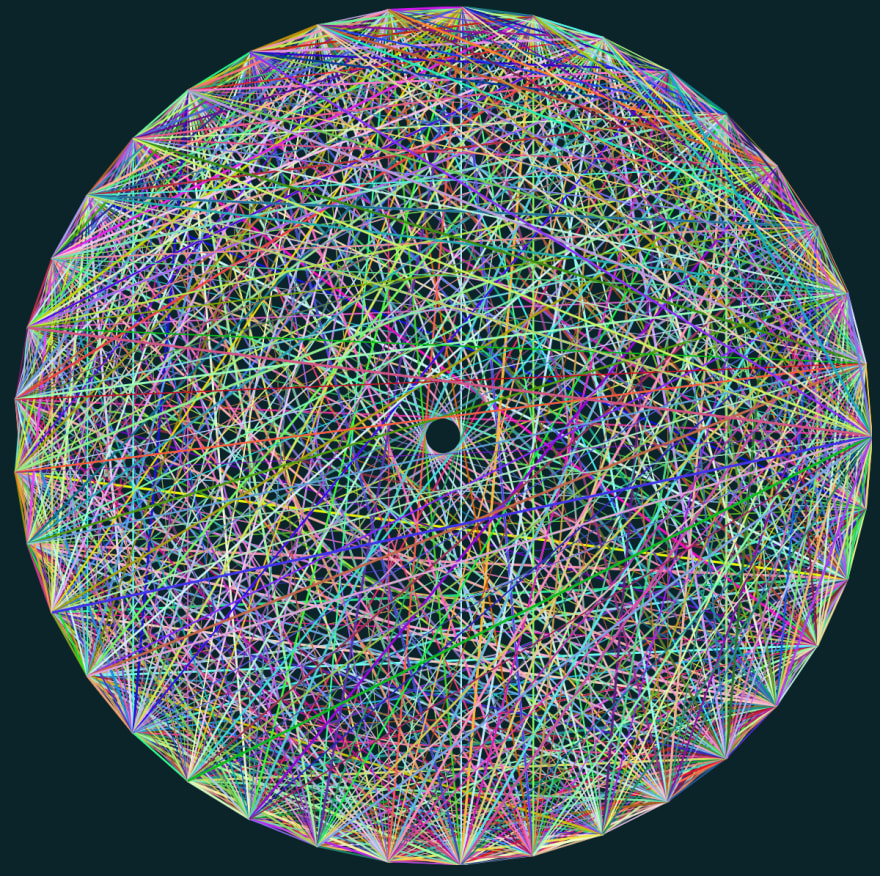
Wow! Almost like a kaleidoscope. Or a rubber-ball!
Demo
I hope this little post inspired you to do some creative things with <svg>.
Below is a Pen, where you can drag the "points"-slider to in- or decrease the number of points.
This content originally appeared on DEV Community 👩💻👨💻 and was authored by Mads Stoumann
Mads Stoumann | Sciencx (2022-09-06T19:00:17+00:00) SVG, Geometry — and a dash of JavaScript. Retrieved from https://www.scien.cx/2022/09/06/svg-geometry-and-a-dash-of-javascript/
Please log in to upload a file.
There are no updates yet.
Click the Upload button above to add an update.