
This content originally appeared on DEV Community and was authored by Michael Levan
At this point, monitoring and observability is something that’s available for all. With the various tools, platforms, and cloud providers that have monitoring and observability tools built-in, there’s really no longer an excuse to not implement proper monitoring and observability.
However, it begs the question - with all of the options, which one should you go with?
In this blog post, you’ll learn about one of the “enterprise” options, Datadog.
What is Datadog
Before talking about Datadog, let’s break down what monitoring and observability are.
Monitoring is how you look at and view data.
Observability is performing an action with that data.
For example, monitoring is so you can look at graphs and charts in real-time or previous time to see what’s happening in an environment. It gives you the ability to say “look at that - CPU is hitting 99%”. Observability takes that data and does something about it. “The CPU is 99%, we need to put automation in place to automatically scale this cluster as it’s capping out in resources”.
You’ll typically see this topic broken down into:
- Monitoring
- Logs
- Traces
- Metrics
- APM
Monitoring is the graphs/visuals. Observability is everything else on the list.
Typically, you need multiple tools to do this for you. Grafana is a monitoring tool and Prometheus is a tool to collect metrics. that means you need tools for traces, logging, and APM. With that, you’re looking at a stack of 4-5 different tools just for monitoring and observability. However, there are tools that combine all of the use cases into one platform. One of those platforms is Datadog.
Datadog gives you the ability to do all of your monitoring and observability in one place.
Pricing
In the opening of this blog post, you may have noticed the “enterprise” option bit. Although this isn’t a specific industry standard, you’ll typically see tools/platforms broken down into two categories:
- Enterprise (paid and supported)
- Homegrown (open-source)
With all enterprise solutions, there will be a cost. With open-source, there won’t be a “price” cost, but there’s still a cost. If you go with an enterprise solution, you’re paying a vendor money. If you go the homegrown route, you’re paying engineers money to manage it for you. Either way, you’re paying money. It’s really a personal preference at that point. There’s no right or wrong answer.
Datadog pricing is broken down into two sections:
- Pricing for datadog itself.
- Price for where you’re running data.
Datadogs pricing is pretty straightforward. $15.00 USD for each node. Ingesting logs starting at $0.10 cents USD. This can of course get expensive depending on your environment.


Where things can be tricky in terms of understanding how to price it out is where you’re running and how much data you’re consuming. For example, understanding how many nodes you have is straightforward, but do you know how many GB of logs are being generated? How many metrics are being passed? That’s where you need to trial and error a tool like this to see what your actual costs will be if you don’t have that data.
There’s also the cost of running agents. Datadogs AWS integration for example - because it’s sending data back and forth from Datadog to your AWS instance, there will be some costs that accrue. Again, it all depends on how much data is passing back and forth.
You can learn more about Datadog pricing here: https://www.datadoghq.com/pricing/
Datadog Agents (Node and Cluster)
When utilizing Datadog for Kubernetes, there will be two types of agents - cluster agents and node agents.
The cluster agent collects data for the overall health and operation of the cluster itself. The node agents are running on each worker node and collecting data about the individual worker nodes. For example, if you have ten (10) worker nodes on your cluster, there will be ten node agents and one cluster agent.
In the next section, you’ll learn how to install Datadog agents on Kubernetes.
Installing Datadog on Kubernetes
When you first sign up for Datadog, you have an option to start installing on whichever platform you’d like. One of the options is Kubernetes.
The problem is that the installation instructions don’t work properly. It essentially just tells you to run a Helm Chart with a values.yaml file, but it doesn’t tell you what values you should have within the Helm Chart.
Below is a command that you can use to install everything you need for successful monitoring and observability of Kubernetes with Datadog.
helm install datadog -n datadog \
--set datadog.site='datadoghq.com' \
--set datadog.clusterName='' \
--set datadog.clusterAgent.replicas='2' \
--set datadog.clusterAgent.createPodDisruptionBudget='true' \
--set datadog.kubeStateMetricsEnabled=true \
--set datadog.kubeStateMetricsCore.enabled=true \
--set datadog.logs.enabled=true \
--set datadog.logs.containerCollectAll=true \
--set datadog.apiKey='' \
--set datadog.processAgent.enabled=true \
 datadog/datadog --create-namespace
Let’s break down what each of these flags does.
- The clusterName flag is to specify your Kubernetes cluster name
- The clusterAgent.replicas and clusterAgent.createPodDistruptionBudget flags are to confirm high availability for the cluster agent.
- kubeStateMetricsEnabled and kubeStateMetricsCore are for kube-state-metrics` to be installed.
- logs is to ensure that logs are being captured from your cluster.
- containerCollectAll is to collect all of the information out of each container running in Pods.
- apiKey is your Datadog API key.
- processAgent.enabled is for live container configurations to see what’s happening in your environment in real-time.
After running the above Helm chart with your appropriate values (API key and cluster name for your environment), you should see an output similar to the screenshot below.

Reviewing Data
Now that the Datadog agents are deployed to your cluster, you can now view the data in the Datadog UI.
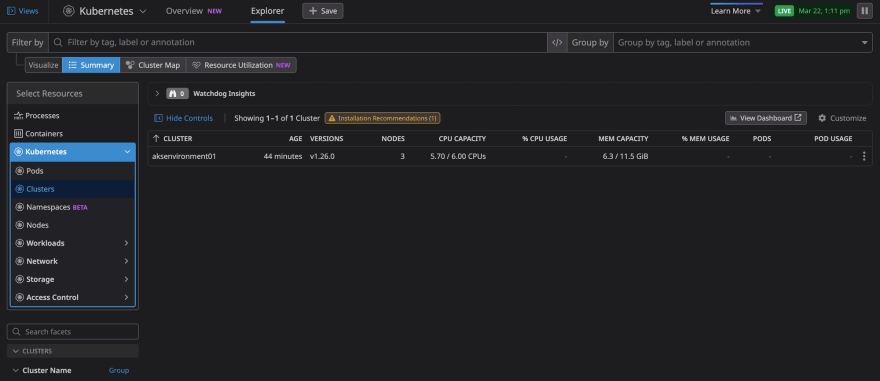
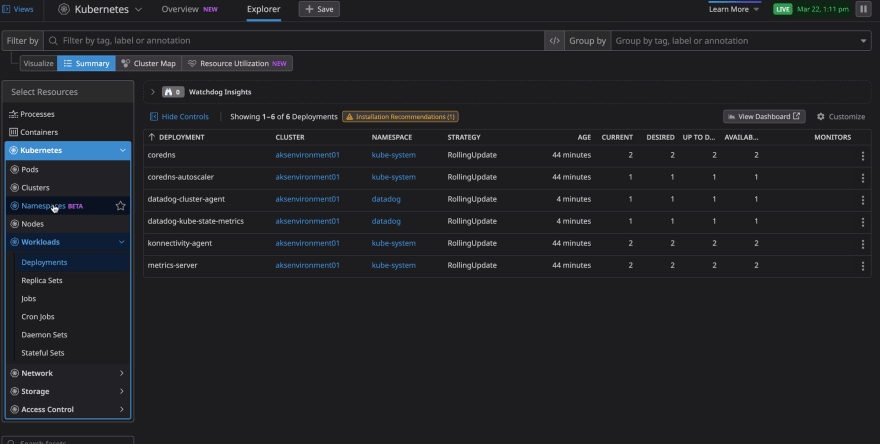
First, log into Datadog and go to Infrastructure —> Kubernetes.

Then, you’ll see your cluster running along with various metrics and other data available.
This content originally appeared on DEV Community and was authored by Michael Levan
Michael Levan | Sciencx (2023-03-29T11:35:33+00:00) Implementing Datadog For Kubernetes. Retrieved from https://www.scien.cx/2023/03/29/implementing-datadog-for-kubernetes/
Please log in to upload a file.
There are no updates yet.
Click the Upload button above to add an update.