
This content originally appeared on HackerNoon and was authored by Tokenomy
Table of Links
Background
Motivating Example and Challenges
Design of AVVERIFIER and 4.1 Overview
Evaluation
5.1 Experimental Setup & Research Questions
5.2 RQ1: Effectiveness & Efficiency
Discussion
5.3 RQ2: Characteristics of Real-world Vulnerable Contracts
To characterize the ecosystem of real-world vulnerable contracts, we firstly illustrate the overall results on all vulnerable ones among over 5M collected ones (see §5.3.1). Then, we focus on the behavioral characteristics, including financial related and activity related, of these vulnerable contracts (see §5.3.2 and §5.3.3).
\ 5.3.1 Overall Results
\ As we mentioned in §5.2.2, we have applied AVVERIFIER on all 5.2M contracts. In total, we have identified 812 vulnerable ones. Among them, we found 443 of them are close-sourced. According to the MD5 results, we have successfully identified 131 unique close-sourced contracts. To recheck the identified results, we decompiled the unique close-sourced ones by contract library tools [1], a well-known decompiler, and asked two Ph.D. students who major in this area to recheck the results. The manual recheck has not revealed any false positives. Due to the unreadability of the close-sourced bytecode, even for the decompiled ones, we can only confirm that 17 of close-sourced contracts are related to Ethereum tokens according to the function signature.
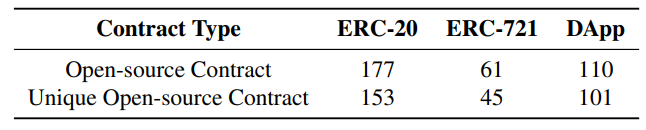
\ As for the remaining 348 true positive cases mentioned in Table 2, we obtained their source code from Etherscan. Similarly, by deduplicating the source code, we finally obtained 299 unique ones. After a manual recheck, the classification results are shown in the Table 3. We can observe that nearly half of them are related to ERC-20, indicating potential financial impacts of this vulnerability. Moreover, around one-third are in the DApp category, like lending market or swap router, which may also bring in impacts to the Ethereum ecosystem.
\ We believe that these open-source contracts can gain more user trust and are more representative. In the following §5.3.2
\
\
\ and §5.3.3, we characterize these 348 open source smart contracts, as a lower-bound of the overall landscape.
\ 5.3.2 Activity Related Metrics
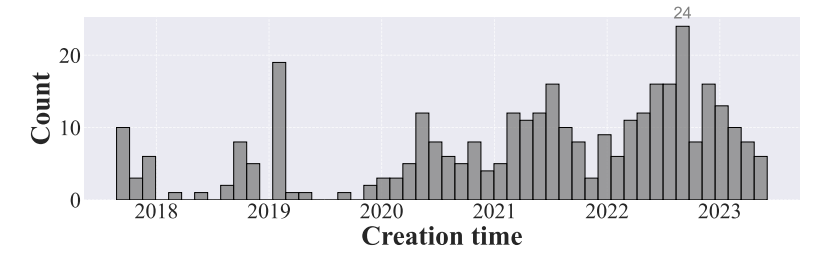
\ To depict the activity of them, we first illustrate the distribution of their deployment time, as shown in Fig. 3. As we can see, the figure illustrates a general upward tendency, which aligns with our intuition as Ethereum has been growing and the propagation of a vulnerability is a temporal phenomenon. There are two noticeable troughs in late-2019 and late-2021. Delving deeper, we discerned that the first trough was primarily influenced by stringent cryptocurrency policies, leading to a liquidity crunch. Meanwhile, the second one can be attributed to the aftermath of the Luna Event [51], which precipitated a significant liquidation of assets, further causing a depletion in liquidity. We can also observe a peak located in the January 2019. This is because the birth of Uniswap [74] in November 2018, which played a pivotal role in the DeFi prosperity, leading to a substantial increase in the number of contract creations as well as the vulnerable ones.
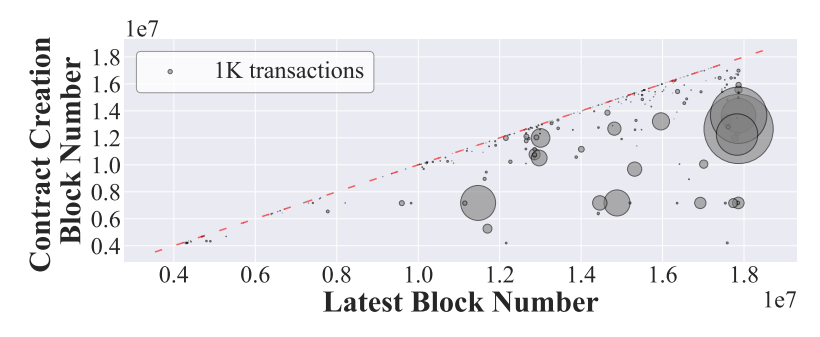
\ We also observe the lifespan of these 348 vulnerable smart contracts in Fig. 4, where the y-axis and x-axis represent the block height when a contract was created and the time when the last transaction occurred respectively. The size of the bubble is proportionally to its historical transaction count. As we can see, there are lots of tiny bubbles locate along or near the diagonal red line. This implies that a significant number of contracts had a very short lifespan. Such a trend suggests a plethora of transient contracts, potentially due to testing exercises, spamming campaigns, or temporary endeavors within the Ethereum ecosystem. Interestingly, while larger bubbles scattered across the figure signify contracts with considerable transactional activity, they may still be susceptible to the address verification vulnerability. We speculate their persistent activity suggests that they may correspond to low balance, which likely diminishes the motivation for attackers to exploit their vulnerabilities. Additionally, we observe some large bubbles distribute near the red line. This indicates a burst of transactions in their earlier phases but have since transitioned into a dormant state. Such an intriguing contrast between their past vibrancy and current inactivity prompts us to further investigate these contracts. Therefore, we have filtered out the transactions of the top 50 contracts in terms of the number of involved transactions, i.e., the size of bubbles. Through a detailed and comprehensive transactional analysis, we found that 3 of them have been exploited already, while 47 of them are at risk. We speculate the reason is that the balance is small and attackers have not noticed yet or are waiting for the opportunity to make a large profit.
\
\
\ 5.3.3 Financial Related Metrics
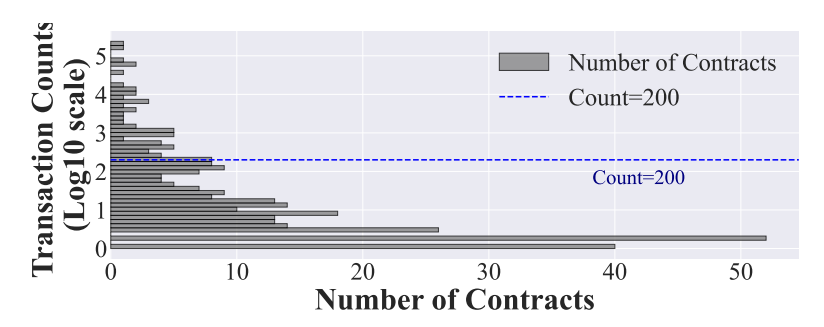
\ We further evaluate the financial impact of these vulnerable smart contracts. Intuitively, by measuring how many transactions are involved in a contract can reflect its financial impact to some extent. Fig. 5 illustrates the distribution of the number of transactions involved in them. We can easily observe that the distribution follows the Pareto principle [29], i.e., there exists a long tail in the distribution. More than 55.46% cases are involved within 5 transactions, while the case named AnySwap [8] is involved in around 237,000 transactions. The results follow the Oliva et al.’s [62], i.e., most contracts in Ethereum are inactive, a small portion of contracts greatly contribute to the prosperity of the Ethereum ecosystem.
\ In addition, we desire to evaluate how many assets are directly involved in them. For DeFi projects, TVL (Total Value Locked) is one of the most representative metrics. Thus, for each case, we retrieve its historical TVL from a third-party API, DeFiLlama [53], a DeFi data browser known for providing metrics like TVL and market cap. For each project, we retrieve their peak TVL as it corresponds to the timestamp when attackers can obtain the most profit. In total, around $11.2 billion was considered to be directly locked into these vulnerable contracts. The top-3 Ethereum projects in terms of compromised assets include Visor[3] [11], TempleDao[4] [13], and AnySwap[5] [65]. Interestingly, except for Anyswap, other two projects immediately stop providing services after being attacked. This is because hackers exploit a vulnerability in Anyswap to indirectly steal tokens from users. Conversely, in the other two projects, the funds within the vulnerable contracts were directly accessed and stolen, leading to an immediate cessation of services. Moreover, the time window between the creation and the corresponding exploitation suggests the opportunity for vulnerability detection and remediation. While Visor saw exploitation within 3 months, Anyswap remained uncompromised for 210 days. Such a variation might result from factors like the implementation complexity, public visibility, or the inherent vulnerability’s nature. However, it proves that there is often a time window to detect and patch vulnerabilities before an attack happens.
\
\
:::info Authors:
(1) Tianle Sun, Huazhong University of Science and Technology;
(2) Ningyu He, Peking University;
(3) Jiang Xiao, Huazhong University of Science and Technology;
(4) Yinliang Yue, Zhongguancun Laboratory;
(5) Xiapu Luo, The Hong Kong Polytechnic University;
(6) Haoyu Wang, Huazhong University of Science and Technology.
:::
:::info This paper is available on arxiv under CC BY 4.0 DEED license.
:::
[3] 0xC9f27A50f82571C1C8423A42970613b8dBDA1
\ [4] ef 40xd2869042E12a3506100af1D192b5b04D65137941
\ [5] 0x6b7a87899490EcE95443e979cA9485CBE7E71522
This content originally appeared on HackerNoon and was authored by Tokenomy
Tokenomy | Sciencx (2025-07-16T11:00:13+00:00) Empirical Analysis of Vulnerable Ethereum Smart Contracts and Their Financial Impact. Retrieved from https://www.scien.cx/2025/07/16/empirical-analysis-of-vulnerable-ethereum-smart-contracts-and-their-financial-impact/
Please log in to upload a file.
There are no updates yet.
Click the Upload button above to add an update.