
This content originally appeared on HackerNoon and was authored by Jurgis
While everyone argues about which chatbot is marginally smarter, the real edge is in pipelines.
Before
- 6–8 hours per company
- Bloomberg → Excel → EDGAR → news
- $24k/year Bloomberg seat
- Static assumptions, one “price target”
After
- One command, ~2.5 minutes
- Live data from free public APIs
- $0 marginal cost per run
- Bull / Base / Bear + stress tests
I realized this after watching a friend spent an entire day updating a single DCF model. Smart work buried under grunt work.
So I built a system to remove the grunt work.
It runs locally on my laptop and does in ~2.5 minutes what takes a human analyst hours.
Below is how I actually use it.
A Market Scanner Built to Find Real Dislocations
I open my Antigravity environment and launch Claude Code. I type one command.
python3 models/market_scanner.py --scan-all
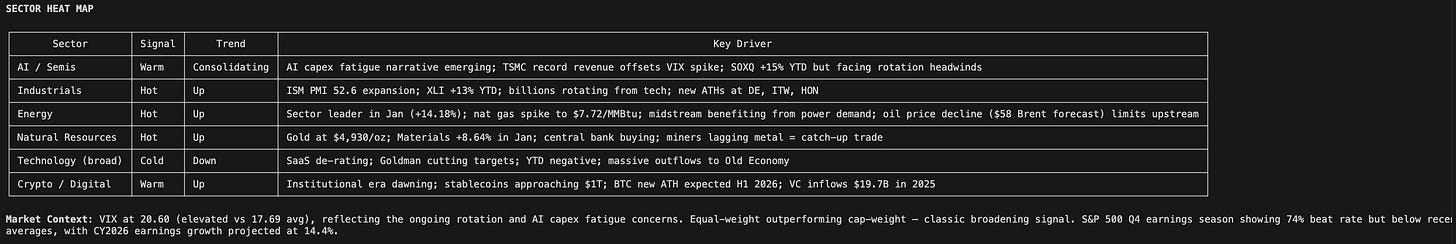
Ninety seconds later, I’m looking at this:
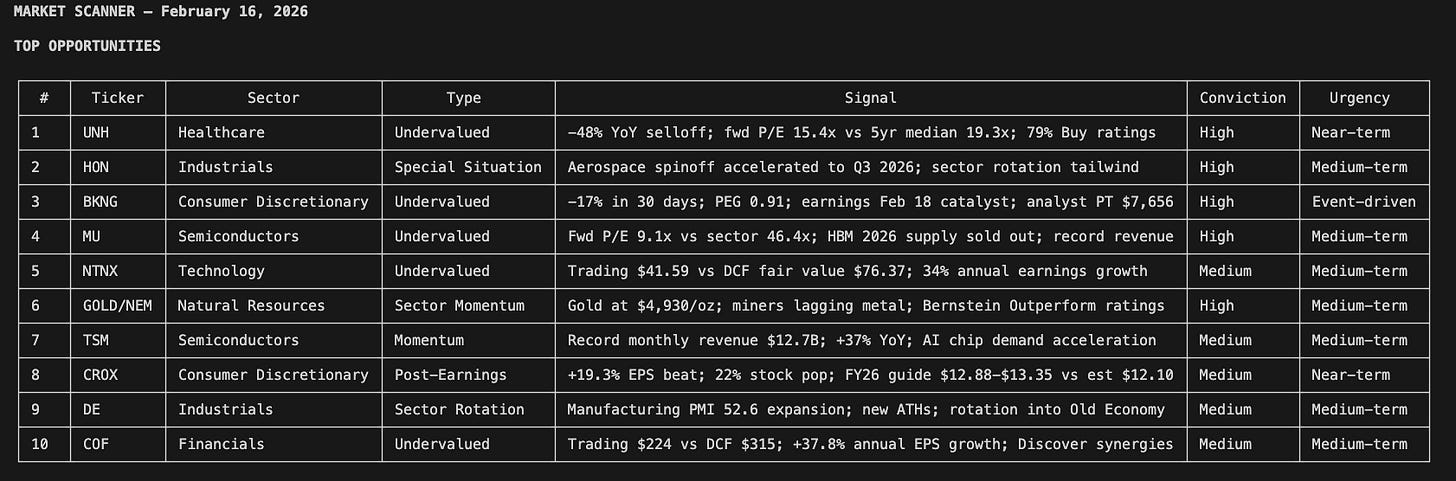
Six sectors scanned. Valuation dislocations flagged. Special situations surfaced. Insider cluster buys detected. Every opportunity filtered through three quality gates: multi-source confirmation, identifiable catalyst, and quantifiable edge.
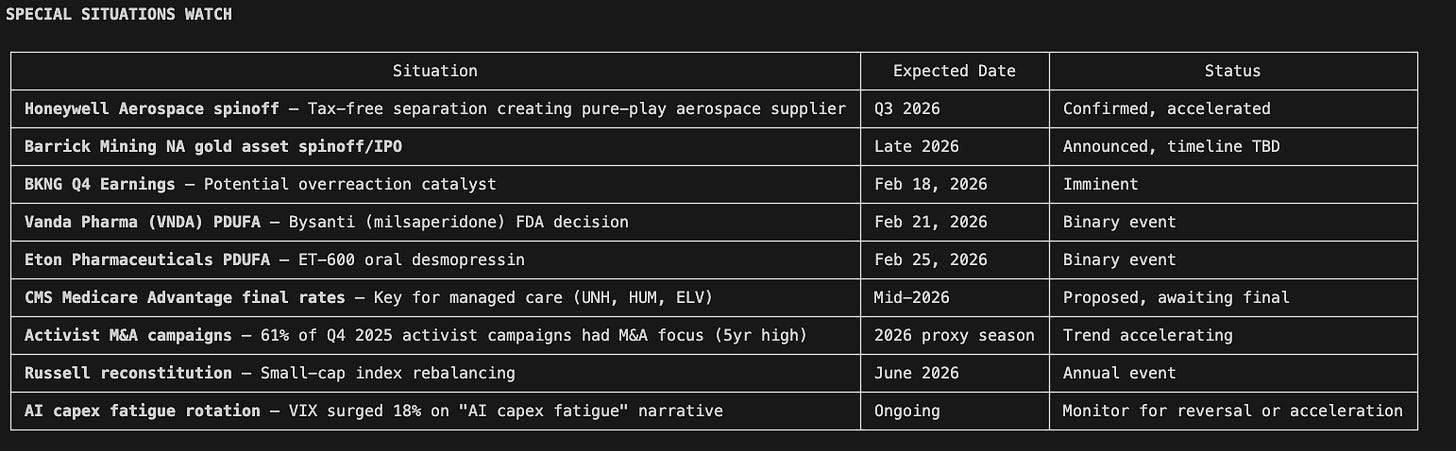
This is a market scanner I built using Google Antigravity and Claude Code. It searches for undervalued and overvalued stocks, special situations (M&A, spinoffs, activist campaigns, index rebalancing), and sector rotation signals, then ranks everything by conviction and urgency. The sector heat map at the bottom tells me where the real money is flowing.
On its own, this replaces a surprising amount of what people use Bloomberg for.
Moreover, when something catches my eye (say, a semiconductor name flagged as 15% undervalued with an insider cluster buy) I don’t open a spreadsheet. I type a second command:
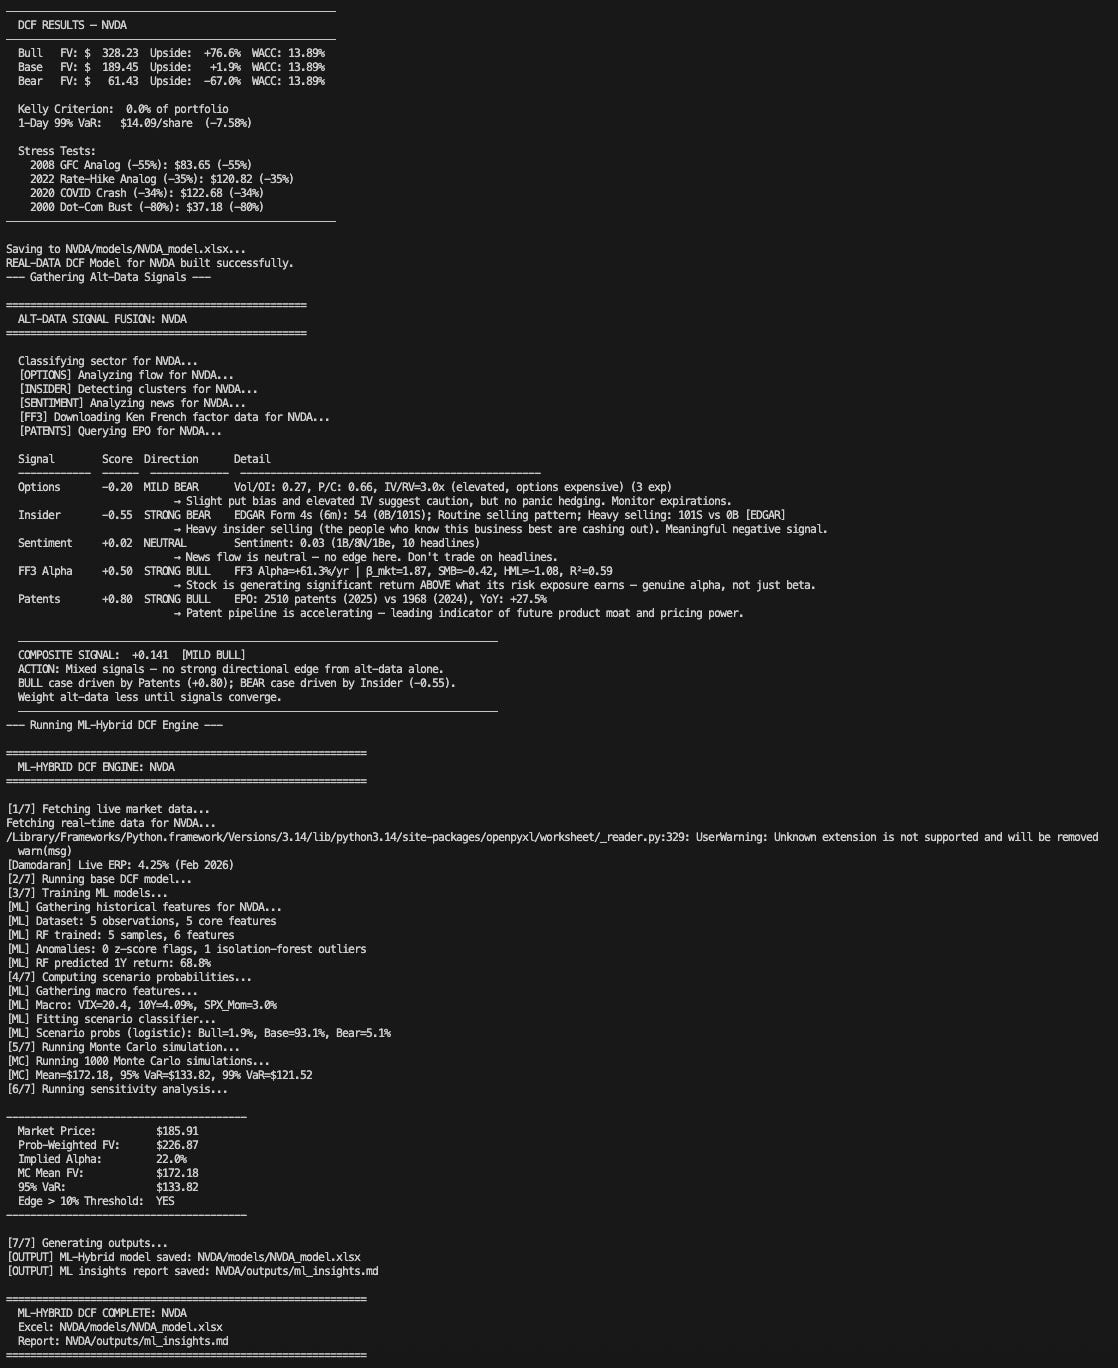
python3 models/research.py NVDA
A few minutes later, I have:
- Live financials
- A three-scenario DCF with sensitivity analysis
- Alt-data signals from multiple sources
- Machine-learning diagnostics trained on historical data
- Monte Carlo stress tests
- Factor exposure analysis
- Position sizing and risk limits
- A Buffett/Munger-style qualitative check
Everything is saved in a structured directory, ready to review.
Why I Built This
A few months ago, I was doing research the usual way:
- Pull financials from a screener
- Update an Excel DCF
- Manually check EDGAR
- Google for sentiment
- Paste everything into a report
I timed it.
One company, done properly, took about eight hours. That was without Monte Carlo simulations, factor regressions, or alternative data.
I started wondering what would happen if the entire workflow, from market-wide scan to single-stock deep dive, ran end to end without manual intervention.
After several iterations, six Python modules, and a lot of refactoring, the answer was clear.
The automated version was more thorough than my manual process. Not because it’s smarter, but because it never skips steps.
The Economics Behind It
The median equity research analyst makes about $108k. A good one costs $200k–$250k.
In return, you typically get:
- Coverage of ~15–20 stocks
- Models refreshed quarterly
- Finite attention and inevitable blind spots
Once you include benefits, desk space, and a $24k/year Bloomberg terminal, the real cost is higher than most people admit.
This system runs on a laptop using free public data sources, with optional APIs for energy and patent data.
The leverage comes from consistency and scale.
[
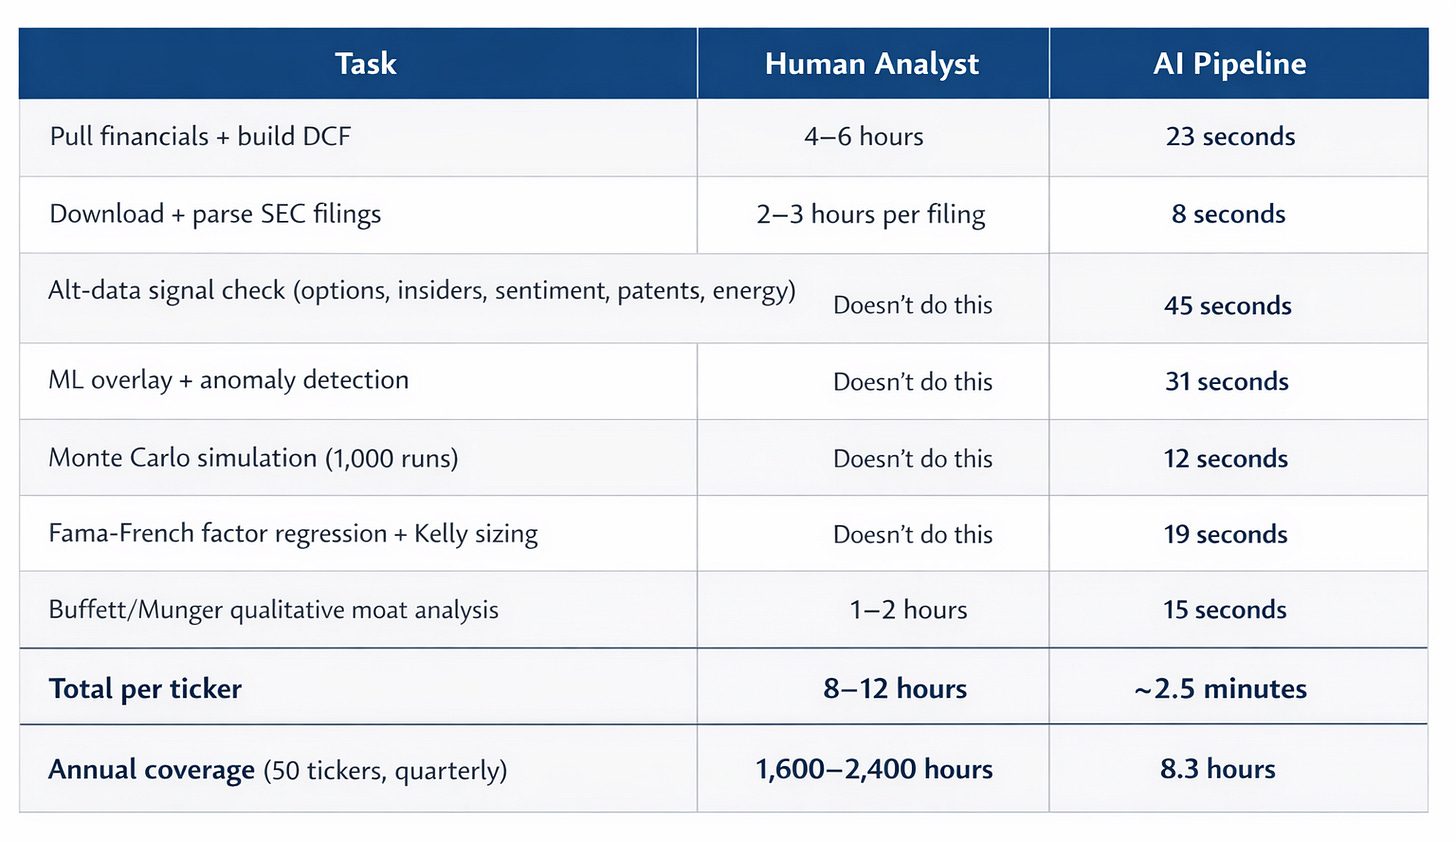
](https://substackcdn.com/image/fetch/$s!kkAH!,fauto,qauto:good,flprogressive:steep/https%3A%2F%2Fsubstack-post-media.s3.amazonaws.com%2Fpublic%2Fimages%2F34d8098f-bc0f-4ecd-bd07-4cfab2ecaee6_1536x888.png)
AI vs. human analyst
The 5-Phase Research Pipeline
In addition to the overall market scanner, the single-stock due diligence is unparalleled by anything I’ve seen thus far.
This is the system architecture: a 5-phase pipeline where each phase feeds the next, and the orchestrator (`research.py`) runs them in sequence
Here’s the flow:
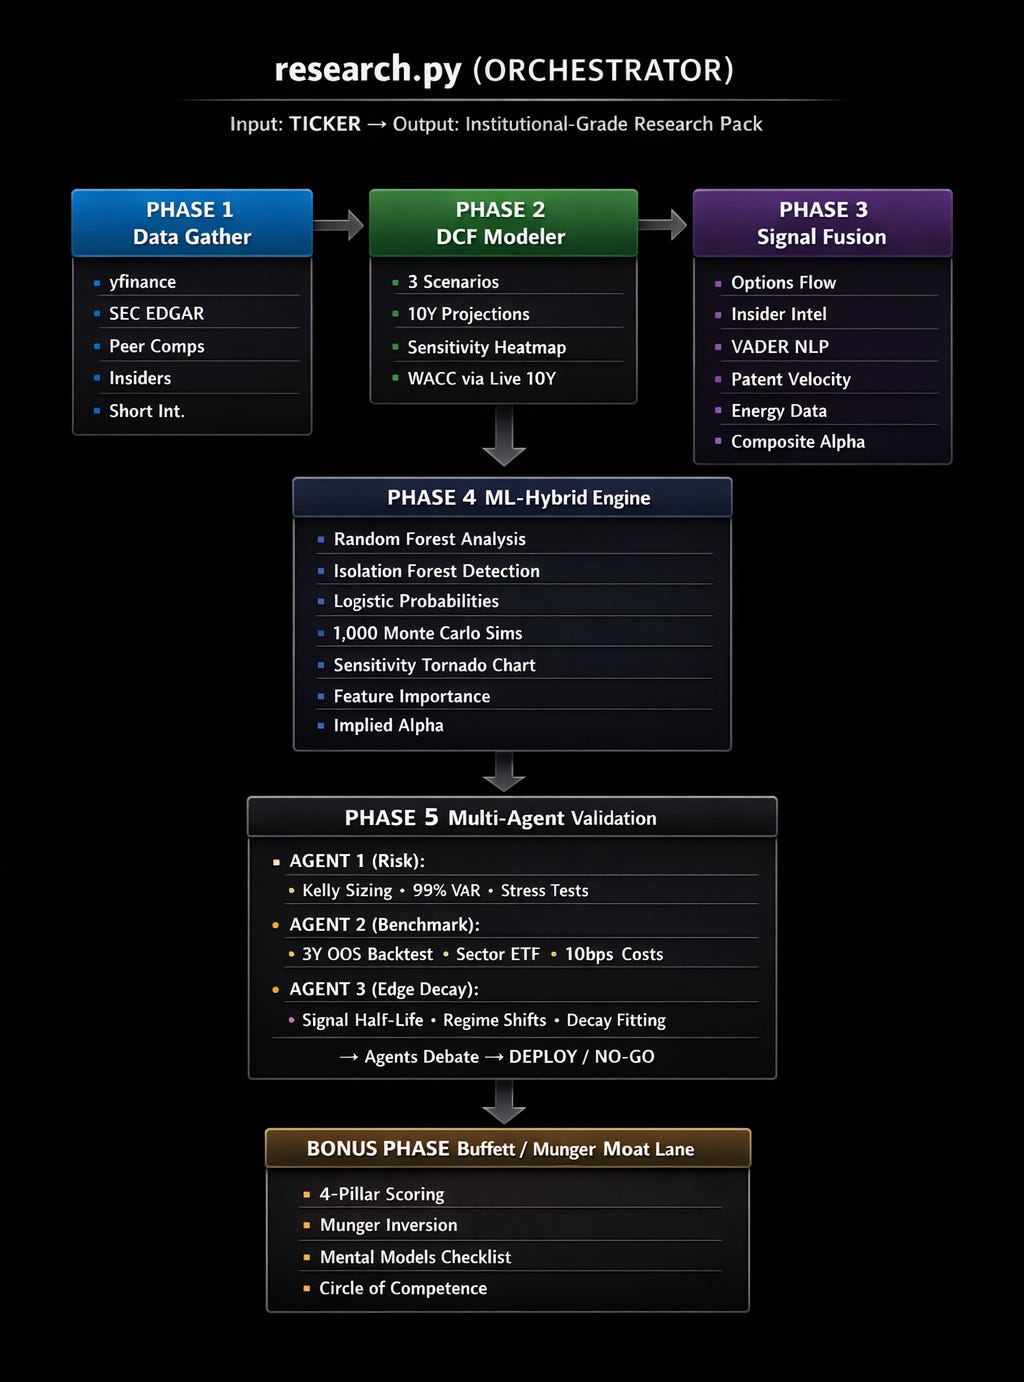
Phase 1: Data Gathering
Pulled in parallel:
- Five years of full financial statements (line items intact)
- ROIC, free-cash-flow margins, and leverage calculated from source data
- Dynamic peer discovery by industry
- Insider transactions from cleaned Form 4 filings
- Short interest metrics
- Raw 10-K and 10-Q filings
Everything is stored cleanly by ticker.
Phase 2: A DCF That Holds Up
Most retail DCFs break down in the assumptions. They use static growth rates, ignore WACC sensitivity, and have one scenario: “the number I want to see.”
This DCF modeler is different.
Instead of static assumptions:
- Live 10-Year Treasury yield feeds WACC
- Actual beta and effective tax rates
- Sector-aware growth decay
- Bull / Base / Bear scenarios
- A full WACC × terminal growth sensitivity grid
The output is a pitch-ready Excel model.
Not this:
rf = 0.04 🤦
This:
tnx = yf.Ticker(’^TNX’)
rf = tnx.history(period=’1d’)[’Close’].iloc[-1] / 100
(*tnx.history = CBOE Interest Rate 10 Treasury notes)
\ Sector-aware growth decay. This is critical and most people get it wrong. A 40% growth company doesn’t grow at 40% for 10 years. But it also doesn’t instantly drop to 3%. The system applies intelligent decay logic:
- Hypergrowth companies (>30% revenue growth): Growth is tapered aggressively, the system assumes competition and market saturation erode the advantage fast, converging toward a ~4% terminal rate.
- Moderate growers (10-30%): Standard convergence, the growth rate fades gradually toward ~3% terminal.
- Slow growers (<10%): Minimal decay, they’re already near terminal, so the model keeps the trajectory realistic at ~2.5%.
This prevents the two most common DCF errors: hyper growth companies getting absurd 10-year projections, and moderate growers flatlining at terminal rate by year 4.
Phase 3: Alt-Data Signal Fusion
The signal fusion engine fuses five alternative data sources into a single composite alpha score:
1. Options Flow Analysis
Not just “is volume high.” The system analyzes the first 3 option expirations to detect:
- Unusual activity: When trading volume is 5x+ the open interest, someone knows something
- Directional bias: Put/Call ratio below 0.7 = bullish flow, above 1.3 = bearish
- Uncertainty pricing: High implied volatility = market expects a big move (and the system penalizes certainty accordingly)
This is multi-expiry analysis, not just front-month, the same approach institutional options desks use.
2. Insider Intelligence
This one has two layers. First, it queries SEC EDGAR directly for Form 4 filing counts over the last 6 months. Then it cross-references with yfinance for buy/sell direction and dollar values.
The scoring is nuanced. For mega-caps, 50+ Form 4 filings with zero buys = routine compensation selling (slightly negative). For mid-caps, 3+ insider cluster buys above $1M = high conviction signal (very positive).
3. Sentiment Analysis (NLP)
Pulls the latest 15 news headlines and runs natural language processing to score each headline on a bullish-to-bearish scale. It doesn’t just average the scores but applies conviction weighting: scores are dampened by 20% to avoid overreacting to noise, and a consensus bonus is added when bullish headlines outnumber bearish ones by 2:1 or more. The result is a sentiment score that reflects genuine market narrative, not headline hysteria.
4. Patent Velocity
For tech/pharma companies, it hits the European Patent Office (EPO) API to count year-over-year patent filings. 500+ patents with 20%+ YoY growth = strong innovation moat. Falls back to R&D spending growth from yfinance when EPO keys aren’t configured.
5. Energy Exposure
Queries the EIA.gov API for natural gas and electricity price trends. Rising energy costs = headwind for energy-intensive companies (data centers, manufacturing). Falling costs = tailwind.
The Composite Score
Each signal gets a weight. Options 20%, Insider 20%, Sentiment 15%, Patents 30% (for tech), Energy 15% (for infra). The weighted composite tells you whether the non-public, non-obvious data aligns with or contradicts the fundamental story.
A composite above +0.4 is a strong bullish signal. Below -0.4 is bearish. This is the edge layer.
Phase 4: ML-Hybrid Engine (Where Science Meets Investing)
This is where the system started catching things I used to miss. Machine learning layered on top of the fundamental analysis.
Random Forest Model: A sort of decision-making engine trained on 10 years of quarterly financial data. It looks at six key factors: net income margin, FCF margin, revenue growth, debt/EBITDA, ROIC, and how the stock’s valuation compares to peers, and learns which of these factors have historically predicted returns for this specific company. It then tells you which factors matter most *right now*.
Isolation Forest + Z-Score Anomaly Detection: Flags data points that look abnormal. Revenue inflection points (growth acceleration >2 standard deviations), margin jumps, ROIC shifts. These are the quarters where something fundamental changed, and most analysts missed it.
Logistic Regression Scenario Probabilities: Instead of guessing “I think Bull is 30% likely,” the system trains a logistic classifier on 5 years of monthly VIX, 10Y yield, and SPX momentum data. It learns what macro environments produce Bull, Base, or Bear outcomes, and outputs calibrated probabilities.
Monte Carlo simulations to stress the model across plausible inputs: Full DCF recalculated 1,000 times. Each simulation perturbs growth rates (±10%), WACC (±1pp), FCF margins (±2.5pp), and terminal growth (±0.5pp). The output is a probability distribution of fair values, with VaR at the 5th and 1st percentile.
The Alpha Calculation
The system calculates implied alpha by comparing the probability-weighted fair value (from all three scenarios) against the current market price. Simply put: *how much upside or downside does the math say exists?*
If implied alpha > 10%, the system flags it: ”EDGE > 10% THRESHOLD.” If it’s below -10%: ”OVERVALUED > 10%.”
The output is a comprehensive Excel workbook with sheets for the Dashboard, Bull/Base/Bear Case, Sensitivity, ML Insights (with feature importance bar charts), Monte Carlo (with histogram), and a Sensitivity Tornado.
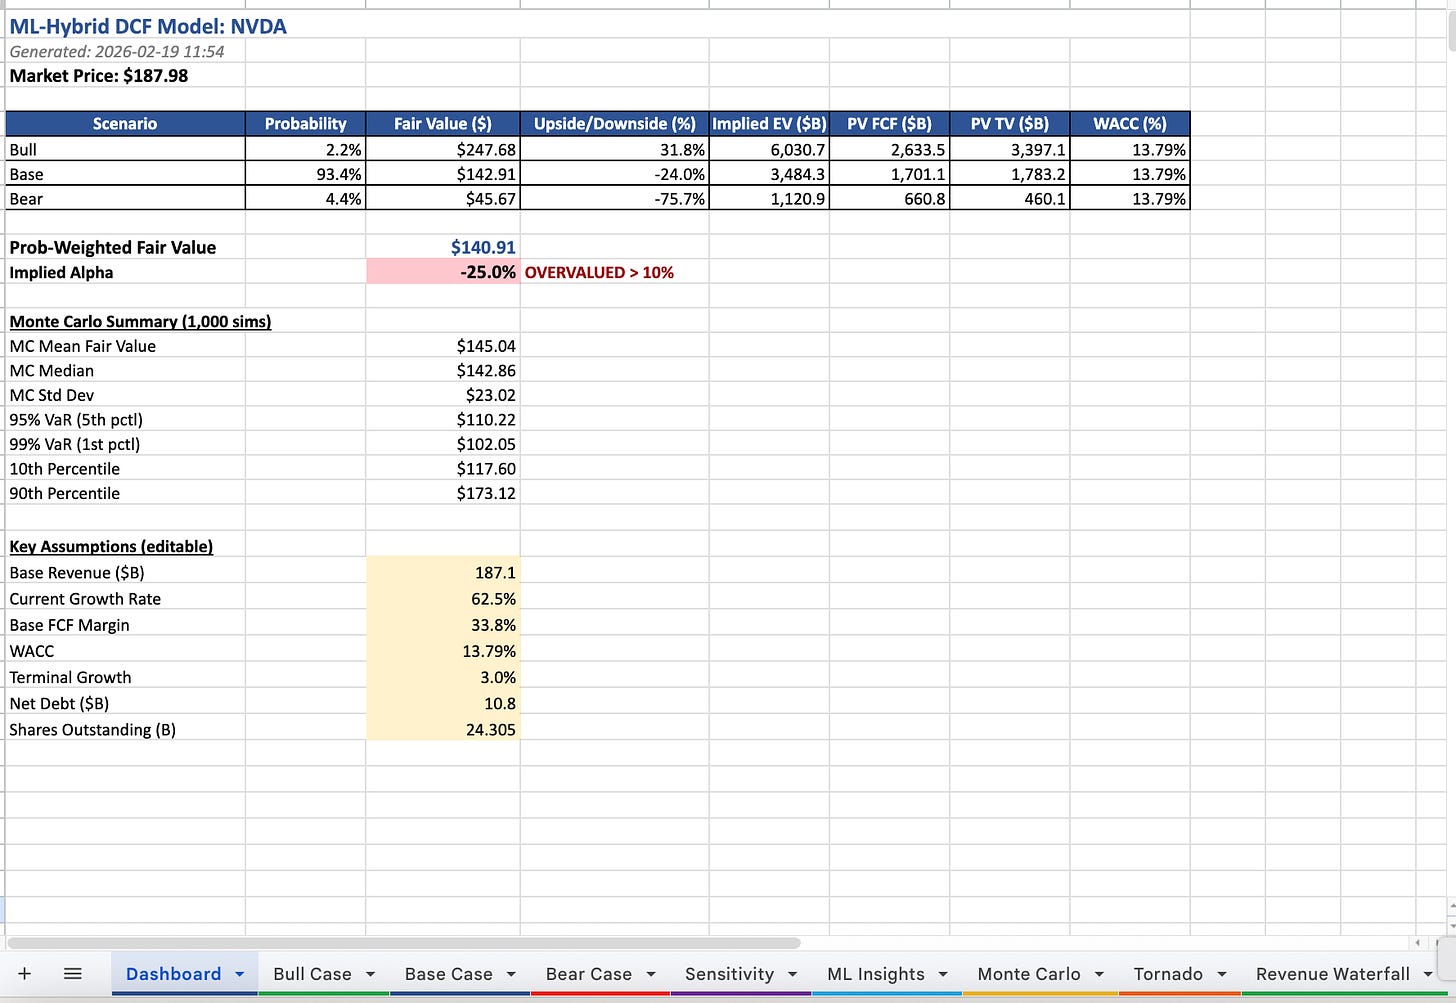
Screenshot of the Excel files the system produced on NVDA
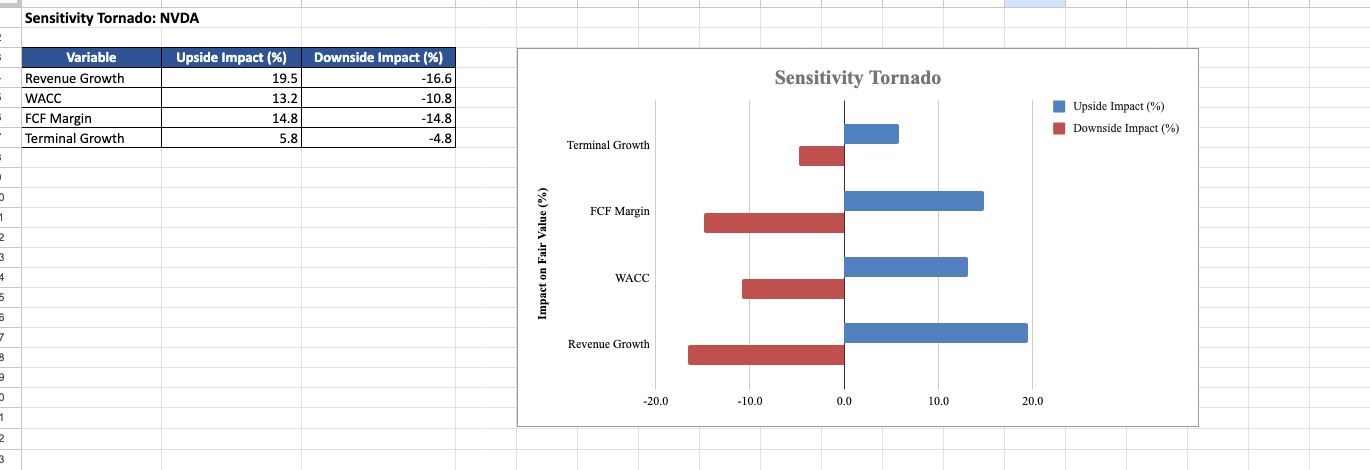
Screenshot of the Excel files the system produced on NVDA
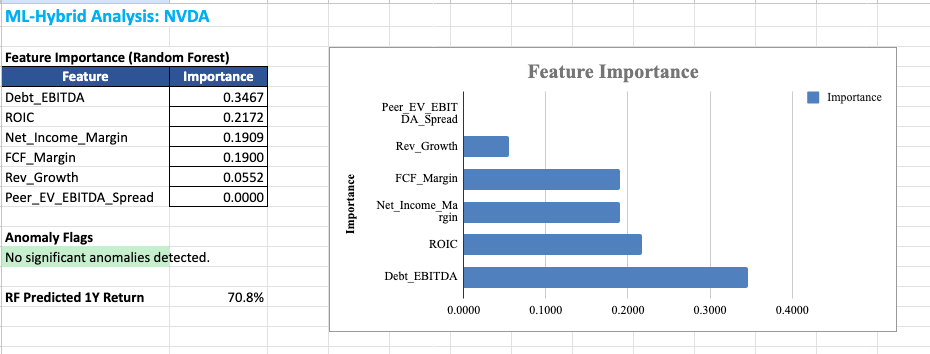
Screenshot of the Excel files the system produced on NVDA

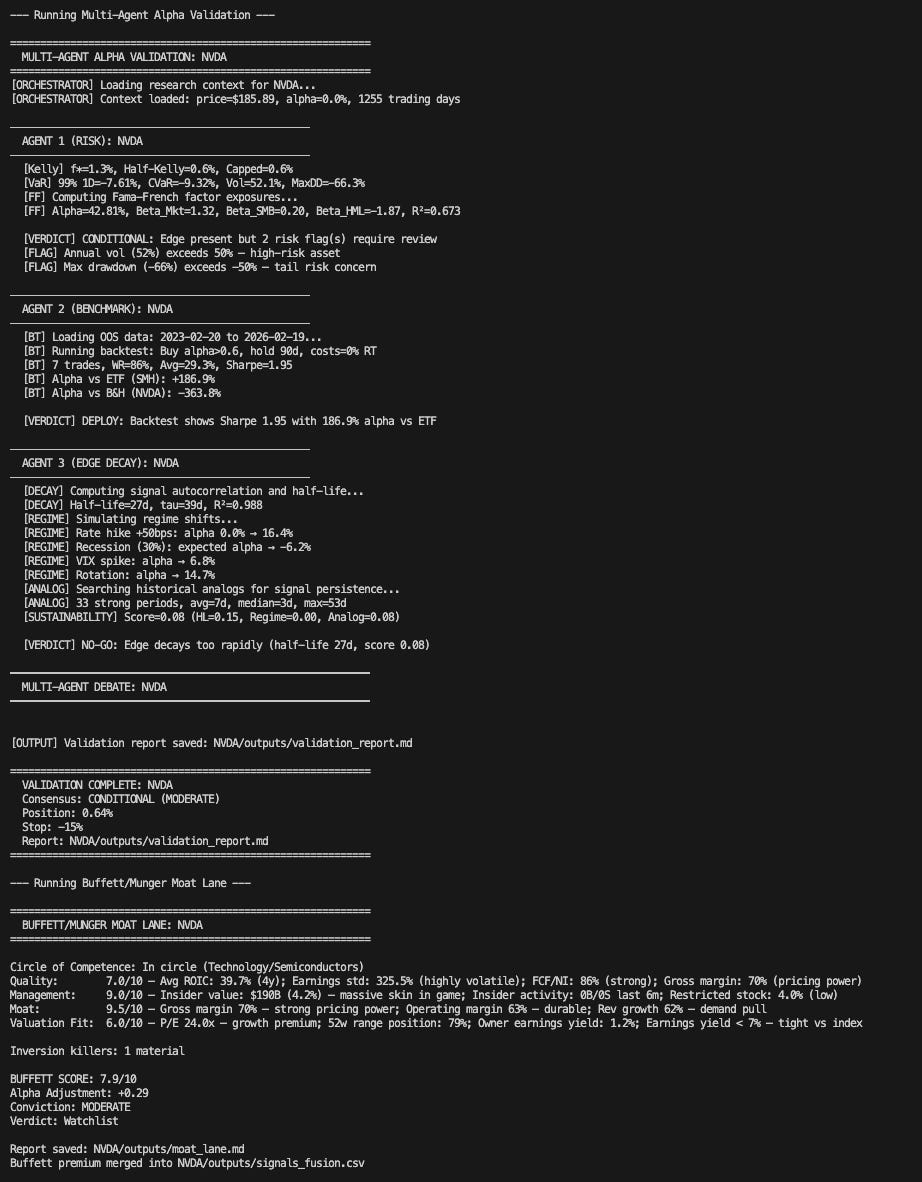
Phase 5: Multi-Agent Validation
Here’s what happens at real funds: the analyst presents their thesis, and then a risk manager, a portfolio manager, and a devil’s advocate try to destroy it. Good ideas survive; bad ones die. Similar to what we used in the voice AI stock analyst automation.
This system simulates that with three specialized agents:
Agent 1 (Risk):
- Kelly Criterion: calculates optimal position size using probability-weighted upside/downside → caps at 5% maximum
- 99% Historical VaR: “On the worst 1% of days over 5 years, how much does this move?”
- Fama-French 3-Factor: regresses returns against Market, Size (IWM-SPY), and Value (IWD-IWF) factors to detect hidden factor exposure
- Stress tests: applies 2008 GFC analog (-55%), 2022 rate hike analog (-66%), and catalyst failure (-30%)
Agent 2 (Benchmark):
- Constructs an alpha signal from 60d momentum, RSI(14), and relative strength vs sector ETF
- Backtests “buy when score > 0.6, hold 90 days” over 3 years out-of-sample
- Includes 10bps round-trip transaction costs
- Compares total return, Sharpe ratio, and alpha vs buy-and-hold and sector ETF
Agent 3 (Edge Decay):
- Fits an exponential decay curve to the signal’s autocorrelation function
- Calculates the half-life in trading days: “How long does this edge last?”
- Simulates four regime shifts: rate hike +50bps, recession 30% probability, VIX spike, and growth-to-value rotation
- Computes an Edge Sustainability Score combining half-life, regime resilience, and historical analog persistence
The three agents then debate. If 2 or 3 say DEPLOY, the system greenlights the position with sizing and stop-loss. If 2 or 3 say NO-GO, it kills the idea. CONDITIONAL verdicts get flagged for human review.
The Buffett/Munger Bonus
I added this because quantitative analysis without qualitative judgment is dangerous.
The Moat Lane (`moat_lane.py`, 696 lines) runs four pillars:
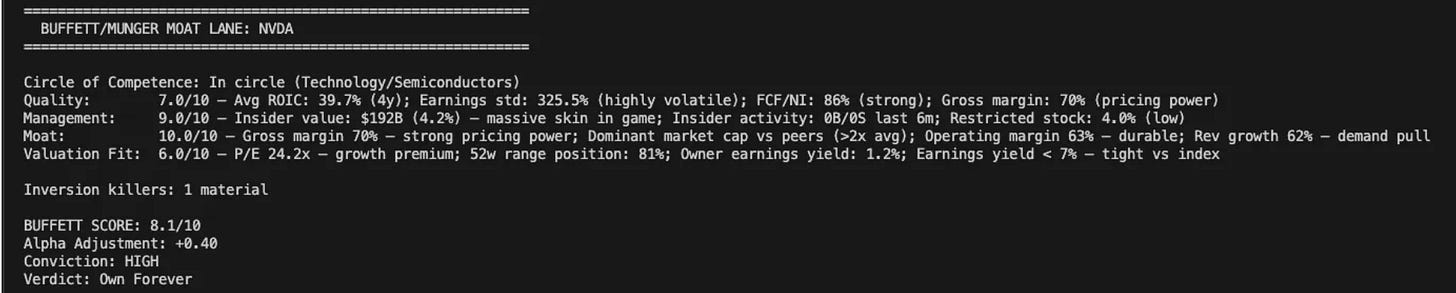
Then it runs Munger Inversion: “What would kill this investment?” Three killers are scored on probability and impact. If any killer has >30% probability AND >30% impact, the Buffett Score is hard-capped at 6.0/10. No exceptions.
Finally, it applies five mental models: Circle of Competence, Margin of Safety (PEG-adjusted), Lollapalooza Effect, Incentive-Caused Bias, and Mr. Market.
The output: a Buffett Score out of 10, an Alpha Adjustment (positive or negative), a Conviction level (HIGH/MODERATE/LOW/AVOID), and a Verdict (Own Forever / Watchlist / Pass / Avoid)
What You Get
When you run `python3 models/research.py NVDA`, here’s what appears in your directory
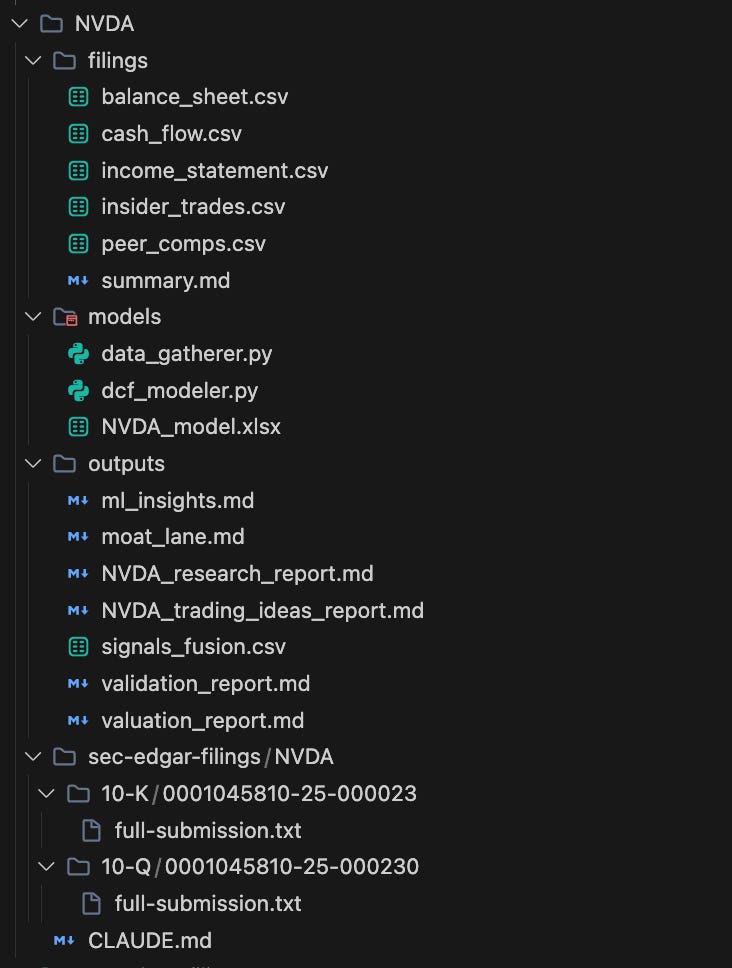
That’s a complete research package. For any public company. In under 5 minutes.
Let that sink in.
Try It Yourself: The 30-Minute Version
You don’t need to write a single line of code to start getting this kind of edge. Here’s how to get 80% of the value using AI tools you already have access to.
Step 1: Set up your AI workspace
Open Claude, ChatGPT, or Gemini. You’re going to use it as your research co-pilot. No coding required, just plain English prompts.
Step 2: Pull live financials
Paste this prompt into your AI tool:
”Pull the latest financials for NVDA. I need: current price, forward P/E, revenue growth rate, free cash flow margin, ROIC (calculated from EBIT × (1 - tax rate) ÷ invested capital), and Debt/EBITDA. Also show me the 5 closest peers by industry with their current P/E and EV/EBITDA for comparison.”
In 30 seconds, you have the same peer comp table that takes an analyst 2 hours in Excel.
Step 3: Run a quick DCF
Follow up with:
“Now run a 3-scenario DCF for NVDA. Use the current 10-Year Treasury yield as the risk-free rate, the stock’s actual beta, and a 4.2% equity risk premium. Project 10 years of free cash flow with growth decay, fast decay for hypergrowth, slow decay for mature. Give me Bull, Base, and Bear fair values, plus a 5×5 sensitivity table of WACC vs terminal growth rate.”
You now have a DCF that uses live market data and intelligent assumptions, not the static “4% WACC” model from your MBA textbook.
Step 4: Check the alternative data
This is where you go beyond what 95% of retail investors do:
”Check the alt-data signals for NVDA: (1) Options flow, is put/call ratio bullish or bearish? Any unusual volume? (2) Insider transactions: net buying or selling over the last 6 months? Dollar amounts? (3) News sentiment: summarize the last 10 headlines and give me an overall bullish/neutral/bearish read. (4) Any notable recent patent activity?”
Step 5: Get the final verdict
Bring it all together:
”Based on everything above, the fundamentals, the DCF fair value range, the peer comparison, and the alt-data signals, give me: (1) Your probability-weighted fair value, (2) The implied upside or downside from current price, (3) The top 3 risks that could kill this thesis, and (4) A conviction level: HIGH / MODERATE / LOW / AVOID.”
That’s four prompts and maybe 30 minutes of your time. You now have more signal on a single ticker than most retail investors generate in a week. Run this for 10 tickers on a Sunday night and you have an institutional-quality watchlist.
The difference between this and the full system? The full system does all of this automatically, adds Monte Carlo simulations, ML anomaly detection, multi-agent validation debates, and Buffett/Munger qualitative overlays, and it does it in 2.5 minutes instead of 30. But this manual version is a powerful starting point.
The difference between prompting an AI manually and running the full automated system is about hours of development time compressed into a single command that runs in under 3 minutes.
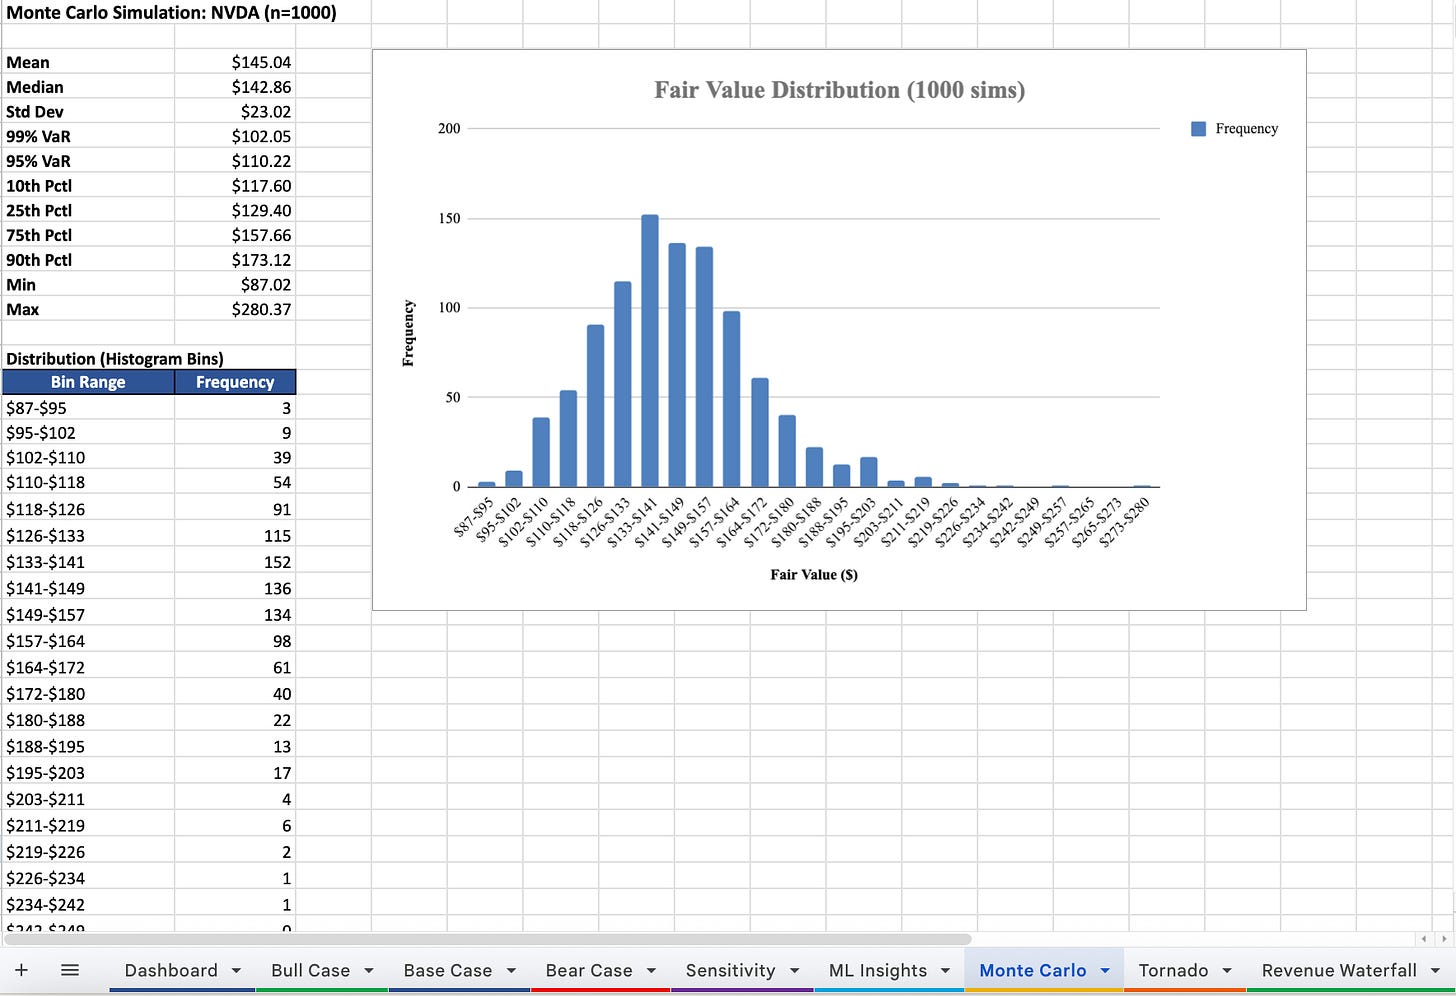
Screenshot of Monte Carlo simulation the system produced on NVDA
You now have everything you need to understand what this system does and why it works.
Below is the complete Alpha Terminal, the fully automated system that runs everything above with a single command. Error handling built in. Graceful fallbacks for missing data. Dynamic peer discovery. Sector-aware logic throughout.
What should I build next?
I have several automations in progress. I’ll build the one you actually want.
Comment or reply with the single most repetitive task in your investment workflow you’d pay to automate(e.g. earnings calls, portfolio monitoring, rebalancing, deal sourcing).
The most requested one becomes next week’s build.
This content originally appeared on HackerNoon and was authored by Jurgis
Jurgis | Sciencx (2026-04-17T05:19:05+00:00) This AI Stock Research Pipeline Turns 8 Hours of Analyst Work Into 2.5 Minutes. Retrieved from https://www.scien.cx/2026/04/17/this-ai-stock-research-pipeline-turns-8-hours-of-analyst-work-into-2-5-minutes/
Please log in to upload a file.
There are no updates yet.
Click the Upload button above to add an update.